
In order to promote public education and public safety, equal justice for all, a better informed citizenry, the rule of law, world trade and world peace, this legal document is hereby made available on a noncommercial basis, as it is the right of all humans to know and speak the laws that govern them.
SURFACE VEHICLE RECOMMENDED PRACTICE
Submitted for recognition as an American National Standard
 , J211-1 REV. MAR95
Issued 1970-10
Revised 1995-03
Superseding J211 OCT88
1. Scope—This SAE Recommended Practice outlines a series of performance recommendations which concern the whole data channel. These recommendations are not subject to any variation and all of them should be adhered to by any agency conducting tests to this practice. However, the method of demonstrating compliance with the recommendations is flexible and can be adapted to suit the needs of the particular equipment the agency is using.
It is not intended that each recommendation be taken in a literal sense, as necessitating a single test to demonstrate that the recommendation is met. Rather, it is intended that any agency proposing to conduct tests to this document should be able to demonstrate that if such a single test could be and were carried out, then their equipment would meet the recommendations. This demonstration should be undertaken on the basis of reasonable deductions from evidence in their possession, such as the results of partial tests.
In some systems it may be necessary to divide the whole channel into subsystems for calibration and checking purposes. The recommendations have been written only for the whole channel, as this is the sole route by which subsystem performances affect the quality of the output. If it is difficult to measure the whole channel performance, which is usually the case, the test agency may treat the channel as two or more convenient subsystems. The whole channel performance could then be demonstrated on the basis of subsystem results, together with a rationale for combining the subsystem results together.
SAE J211-1 covers electronic instrumentation and SAE J211-2 covers photographic instrumentation.
1.1 Purpose—The purpose of this document is to provide guidelines and recommendations for the techniques of measurement used in impact tests. The aim is to achieve uniformity in instrumentation practice and in reporting test results. Use of this document will provide a basis for meaningful comparisons of test results from different sources.
1.2 Field of Application—The instrumentation as defined in this document applies in particular to impact tests for road vehicles, including tests of their subassemblies and occupant surrogates.
SAE Technical Standards Board Rules provide that: “This report is published by SAE to advance the state of technical and engineering sciences. The use of this report is entirely voluntary, and its applicability and suitability for any particular use, including any patent Infringement arising therefrom, is the sole responsibility of the user.”
SAE reviews each technical report at least every five years at which time it may be reaffirmed, revised, or cancelled. SAE invites your written comments and suggestions.
QUESTIONS REGARDING THIS DOCUMENT: (724) 772-8512 FAX: (724) 776-0243
TO PLACE A DOCUMENT ORDER; (724) 776-4970 FAX: (724) 776-0790
SAE WEB ADDRESS http://www.sae.org
Copyright 1995 Society of Automotive Engineers, Inc.
All rights reserved
Printed in U.S.A.
1SAE J211-1 Revised MAR95
2. References
2.1 The following publications form a part of the specification to the extent specified herein. Unless otherwise indicated the latest revision of SAE publications shall apply.
2.1.1 SAE PUBLICATIONS—Available from SAE, 400 Commonwealth Drive, Warrendale, PA 15096-0001.
SAE J670—Vehicle Dynamics Terminology
SAE J1727—Injury calculation Guidelines
SAE J1733—Sign Convention for Vehicle Crash Testing
SAE Paper 930100
Minutes of the SAE Safety Test Instrumentation Subcommittee meetings held on April 16, September 24, November 21, 1986, and June 25, 1993
2.1.2 NHTSA PUBLICATION—Available from Department of Transportation, The Office of Crashworthiness Research, 408 7th Street SW, Washington, DC 20590.
NHTSA Data Tape Reference Guide (Version 4): Volume 1 - Vehicle Tests, Volume 2 - Biomechanics, Volume 3 - Components, and Volume 4 - Signal Waveform Generator
3. Definitions—The definitions in 3.5 to 3.14 apply to the whole data channel, as defined in 3.1.
3.1 Data Channel—All of the instrumentation from and including a single transducer (or multiple transducers whose outputs are combined in some specified way) up to and including any analysis procedures that may alter the frequency content or the amplitude content or the timing of data. It also includes all cabling and interconnections.
3.2 Transducer—The first device in a data channel, used to convert a physical quantity to be measured into a second quantity (such as an electrical voltage) which can be processed by the remainder of the channel. For transducer equivalency see Appendix B.
3.3 Full Scale—The maximum usable linear range of a data channel.
3.4 Data Channel Full Scale—That value of a data channel determined by the component of the channel with the lowest full scale level. This is expressed in terms of the measured variable (input). For example, FS = 50 G, 1000 N, 100 cm/s, etc.
3.5 Channel Amplitude Class, CAC—The designation for a data channel that meets certain amplitude characteristics as specified by this document.
The CAC number is numerically equal to the upper limit of the measurement range (that is, equivalent to the data channel full scale.)
3.6 Characteristic Frequencies, FH, FL, FN—These frequencies are defined in Figures 1 and C1.
3.7 Channel Frequency Class, CFC—The channel frequency class is designated by a number indicating that the channel frequency response lies within limits specified by Figure 1 for CFCs of 1000 and 600, or is filtered using the algorithm described in Appendix C for CFCs of 180 and 60.
This number and the value of the frequency FH in hertz are numerically equal.
3.8 Calibration Value—The value measured and read during the calibration of a data channel (see 4.6).
2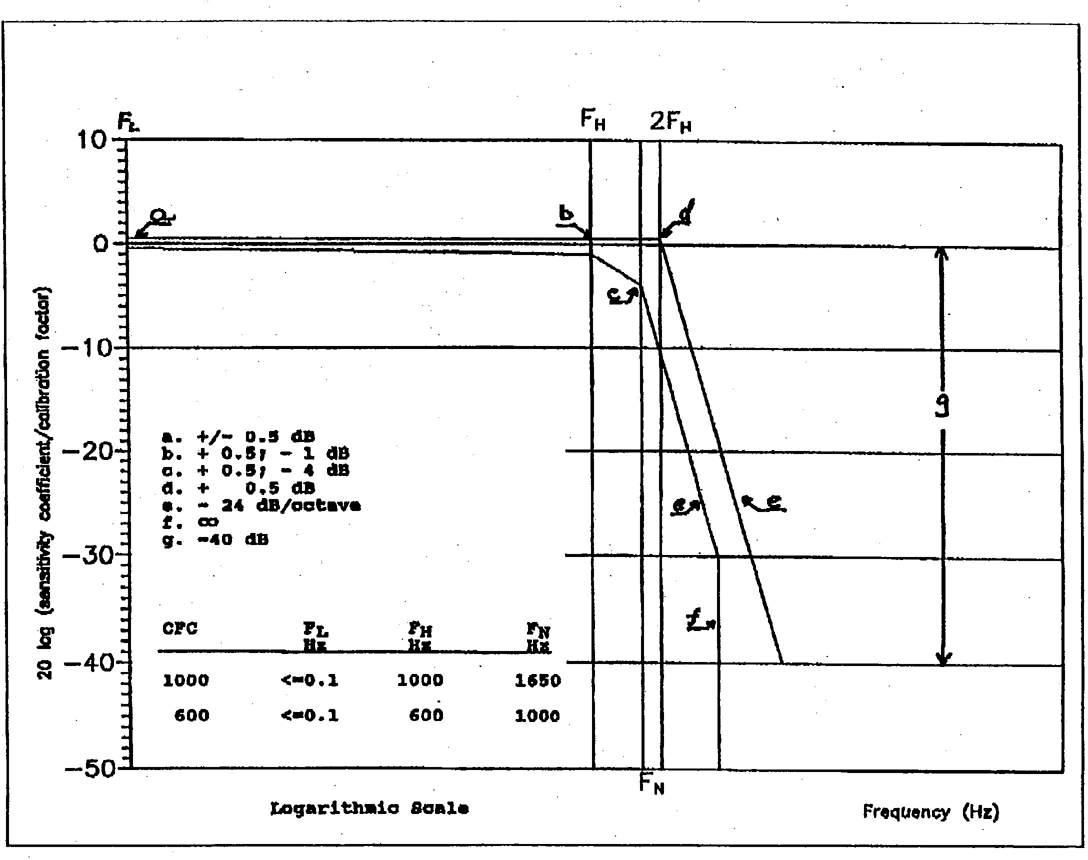
FIGURE 1—DATA CHANNEL DYNAMIC ACCURACY, CLASS 600 AND 1000
3.9 Sensitivity Coefficient—The slope of the straight line representing the best fit to the calibration values determined by the method of least squares within the channel amplitude class.
3.10 Calibration Factor of a Data Channel—The arithmetic mean of the sensitivity coefficients evaluated over frequencies which are evenly spaced on a logarithmic scale between FL and FH/2.5.
33.11 Linearity Error—The ratio, in percent, of the maximum difference between the calibration value and the corresponding value read on the straight line defined in 3.9 at the upper limit of the channel amplitude class (data channel full scale).
3.12 Sensitivity—The ratio of the output signal (in equivalent physical units) to the input signal (physical excitation), when an excitation is applied to the transducer. (Example: 10.24 mV/G/V for a strain gage accelerometer.)
3.13 Phase Delay Time—The phase delay time of a data channel is equal to the phase delay (in radians) of a sinusoidal signal, divided by the angular frequency of that signal (in radians per second).
3.14 Environment—The aggregate, at a given moment, of all external conditions and influences to which the data channel is subjected.
3.15 Transverse Sensitivity (of a rectilinear transducer)—The sensitivity to excitation in a nominal direction perpendicular to its sensitive axis.
NOTE—The transverse sensitivity is usually a function of the nominal direction of the axis chosen.
3.16 Transverse Sensitivity Ratio (of a rectilinear transducer)—The ratio of the transverse sensitivity to its sensitivity along its sensitive axis.
4. Data Channel Performance Requirements
4.1 Linearity Error—The absolute value of the linearity error of a data channel at any frequency in the CFC shall be less than or equal to 2.5% of the value of the CAC through the whole measurement range. In general, a sufficient number of measurements should be carried out in order to ensure the linearity in the range of interest, that is, between FL and FH.
4.2 Amplitude Against Frequency—The frequency response of a data channel shall lie within the limiting curves given in Figure 1 for CFCs of 1000 or 600. For CFCs of 180 or 60, the frequency response of the channel is determined by the filter algorithm described in Appendix C. The 0 dB line is defined by the calibration factor.
4.3 Phase Delay Time—The phase delay time between the input and the output of a data channel shall be determined, and shall not vary more than 1/(10*FH) is between 0.03*FH and FH. This includes the transducer, that is, the input is the excitation to the transducer.
4.4 Time
4.4.1 TIME BASE—A time base shall give at least 1/100 s resolution with an error of less than 1/10 000 s.
4.4.2 RELATIVE TIME DELAY—The relative time delay between the signals of two or more data channels regardless of their frequency class must not exceed 1 ms excluding phase delay caused by phase shift. Two or more data channels of which the signals are combined shall have the same frequency class and shall not have a relative time delay greater than 1/(10*FH) s.
This requirement applies to analog signals as well as synchronization pulses and digital signals.
4.5 Transducer Transverse Sensitivity Ratio—The transverse sensitivity ratio of all transducers shall be less than 5% in any direction.
44.6 Calibration—Values in this section apply to reference equipment or “standards” against which a data channel is “calibrated,” that is, its performance is determined.
4.6.1 GENERAL—A data channel shall be calibrated at least once a year against reference equipment traceable to known standards. The methods used to carry out a comparison with reference equipment shall not introduce an error greater than 1% of the CAC. The use of the reference equipment is limited to the range of frequencies for which they have been calibrated.
Subsystems of a data channel may be evaluated individually and the results factored into the accuracy of the total data channel. This can be accomplished for example by an electrical signal of known amplitude simulating the output signal of the transducer which allows a check to be made on the gain of the data channel, except the transducer.
4.6.2 ACCURACY OF REFERENCE EQUIPMENT FOR CALIBRATION—The accuracy of the reference equipment shall be certified or endorsed by an approved metrology service (for example, traceable to the National Institute of Standards and Technology).
4.6.2.1 Static Calibration
4.6.2.1.1 Accelerations—The error shall be less than 1.5% of the channel amplitude class.
4.6.2.1.2 Forces—The error shall be less than 1% of the channel amplitude class.
4.6.2.1.3 Displacements—The error shall be less than 1% of the channel amplitude class.
4.6.2.2 Dynamic Calibration
4.6.2.2.1 Accelerations—The error in the reference accelerations expressed as a percentage of the channel amplitude class shall be less than 1.5% below 400 Hz, less than 2% between 400 and 900 Hz, and less than 2.5% between 900 Hz and the maximum frequency at which the reference acceleration is utilized 4.6.4.
4.6.2.2.2 Forces and Displacements—(No method for the evaluation of the dynamic response during calibration of data channels for forces and displacements is included since no satisfactory method is known at present.)
4.6.2.3 Time—The error in the reference time shall be less than 0.00001 s.
4.6.3 SENSITIVITY COEFFICIENT AND LINEARITY ERROR—The sensitivity coefficient and the linearity error shall be determined by measuring the output signal of the data channel against a known input signal, for various values of this signal. (The input signal is referenced to well-known physical data, that is, a load or acceleration, but not voltage.)
5The calibration of the data channel shall cover the whole range of the amplitude class. (This is between FL and FH/2.5.)
For bidirectional channels, both the positive and negative values shall be evaluated. If the calibration equipment cannot produce the required input, due to excessively high values of the quantity to be measured, calibrations shall be carried out within the limits of these calibration standards and these limits shall be recorded in the report.
A total data channel shall be calibrated at a frequency or at a spectrum of frequencies with its significant values comprised between FL and FH/2.5.
4.6.4 CALIBRATION OF THE FREQUENCY RESPONSE—The response curves of phase and amplitude against frequency for the data channel shall be determined by measuring the output signals of the data channel in terms of phase and amplitude against a known input signal, for various values of this signal varying between FL and 10 times the CFC or 3000 Hz, whichever is the lower value.
4.7 Environmental Effects—The presence of any environmental effects shall be checked (that is, electric or magnetic flux, electrostatic discharge, cable velocity, etc.). This can be done, for instance, by recording the output of spare channels equipped with dummy transducers. If such an output signal is greater than 2% of the expected data peak value, corrective action shall be taken, for instance re-allocation or replacement of cables.
4.8 Choice and Designation of the Data Channel—The CAC and CFC define a data channel.
A data channel consistent with the specifications of this document shall be designated according to the following codes:
SAE J211 XXXXX—(number of this document)
CAC…—(channel amplitude class)
CFC…—(channel frequency class)If the calibration of the amplitude or frequency response does not cover the complete CAC or CFC owing to limited properties of the calibration equipment, then the CAC or CFC shall be marked with an asterisk.
Example,
SAE J211 XXXX
CAC* 200 m/s2
CFC 1000 Hzmeans that:
- This measurement has been carried out according to this document
- The channel amplitude class was 200 m/s2
- The channel frequency class was 1000 Hz
- The calibration of the amplitude response did not cover the complete CAC
The test report shall indicate the calibration limits.
5. Data Channel Selection—The selection of a frequency response class is dependent upon many considerations, some of which may be unique to a particular test. The ultimate usage of the data and good engineering judgment will determine what portions of the frequency spectrum are significant or useful. The various classes of frequency response in Figures 1 and C1 are intended to permit appropriate choice for different engineering requirements.
6It is important to note that valid comparisons using different frequency response classes may be difficult to make. It is useful to establish specific frequency response classes when comparing test result from different sources. The frequency response classes in Table 1 are recommended for that purpose. These recommendations reflect current practices and equipment. However, it is recognized that other considerations (for example, biomechanics) may impose special instrumentation requirements.
The channel class recommendations for a particular application should not be considered to imply that all the frequencies passed by that channel are significant for the application. In several cases, such as occupant head accelerations, headform accelerations, and femur force, the recommendation may be higher than necessary, but current biomechanical knowledge will not permit a closer specification. All data are to be gathered at class 1000 or higher, for any purpose.
| Typical Test Measurements | Channel Frequency Class (CFC) |
|---|---|
| Vehicle structural accelerations for use in: | |
| Total vehicle comparison | 60(1) |
| Collision simulation input | 60 |
| Component analysis | 600 |
| Integration for velocity or displacement | 180 |
| Barrier face force | 60 |
| Belt restraint system loads | 60 |
| Anthropomorphic Test Device | |
| Head accelerations (linear and angular) | 1000 |
| Neck | |
| Forces | 1000(2)(3) |
| Moments | 600(2)(3) |
| Thorax | |
| Spine accelerations | 180 |
| Rib accelerations | 1000(2) |
| Sternum accelerations | 1000(2) |
| Deflections | 600(2)(4) |
| Lumbar | |
| Forces | 1000(5) |
| Moments | 1000(5) |
| Pelvis | |
| Accelerations | 1000(5) |
| Forces | 1000(5) |
| Moments | 1000 |
| Femur/Knee/Tibia/Ankle | |
| Forces | 600 |
| Moments | 600(2) |
| Displacements | 180(2) |
| Sled acceleration | 60 |
| Steering column loads | 600 |
| Headform acceleration | 1000 |
|
|
6. Mounting of Transducers—Mechanical resonances associated with transducer mounting should not distort readout data.
Transducers should be mounted on dummies using a support specially provided for this purpose. In cases where properties of nonmechanical test subjects preclude rigid transducer mounting, an analytical or experimental evaluation of mounting effects on the data should be provided.
Acceleration transducers, in particular, should be mounted in such a way that the initial angle of the actual measurement axis to the corresponding axis of the reference axis system is not greater than 5 degrees unless analytical or experimental assessment of the effect of the mounting on the collected data is made. When multiaxial accelerations at a point are to be measured, each acceleration transducer axis should pass within 10 mm of that point, and the center of seismic mass of each accelerometer should be within 30 mm of that point.
7. Sign Convention—In order to compare test result obtained from different crash test facilities, standardized coordinate systems need to be defined for crash test dummies, vehicle structures, and laboratory fixtures. In addition, recorded polarities for various transducer outputs need to be defined relative to positive directions of the appropriate coordinate systems. This section describes the standardized sign convention.
7.1 Right-Handed Coordinate System—To assure consistent vector directions of moments and angular velocities and accelerations produced by vector multiplications, all coordinate systems used in vehicle testing will be "right-handed."
Right-handed coordinate system consists of an ordered set of three mutually perpendicular axes (x, y, z) which have a common origin and whose positive directions point in the same directions as the ordered set of the thumb, forefinger, and middle finger of the right hand when positioned as shown in Figure 2. Note that one can choose the positive x-axis to point in the direction of either the thumb, forefinger, or middle finger as shown in the orientations 1, 2, and 3 of Figure 2. However, once this decision is made then the positive directions of the y and z axes must be as indicated by corresponding orientation shown in Figure 2.
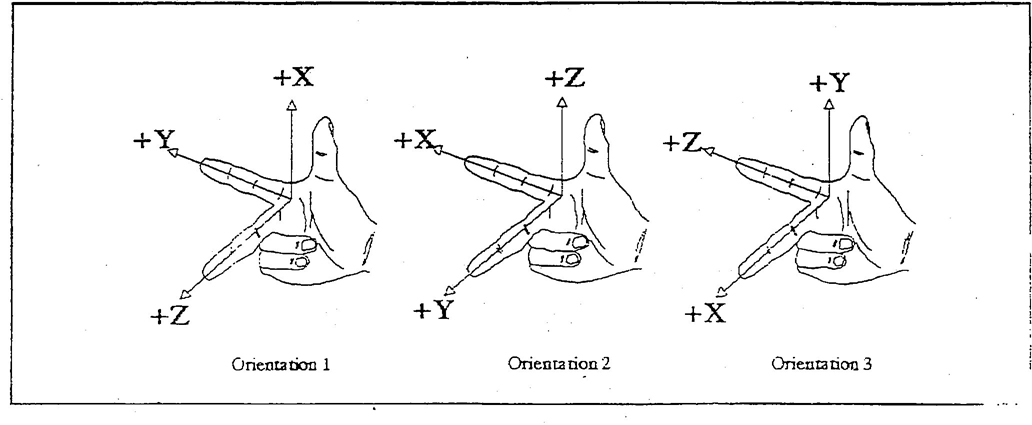
FIGURE 2—THE THREE POSSIBLE ORIENTATIONS OF A RIGHT-HANDED COORDINATE SYSTEM RELATIVE TO THE THUMB, FOREFINGER, AND MIDDLE FINGER OF THE RIGHT HAND
8Positive angular motion and moment directions are determined by the right-handed screw rule. If a positive axis is grasped with the right hand with the thumb extended in the positive direction as shown in Figure 3, then the curl of the fingers indicate the positive direction for angular motions and moments.
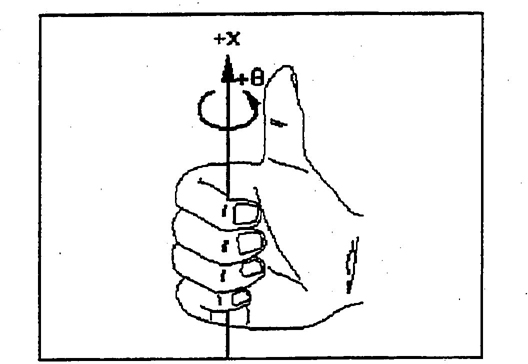
FIGURE 3—RIGHT-HANDED SCREW RULE
A simple method to determine if a (x, y, z) coordinate system is right-handed is to rotate the system 90 degrees about the z-axis using the right-handed screw rule. If the positive x-axis rotates to the position previously occupied by the positive y-axis, then the system is right handed.
7.2 Vehicle and Laboratory Coordinate System—For vehicle and laboratory coordinate systems, positive z-axis will be directed downward, positive x-axis will be directed forward relative to the vehicle, and positive y-axis will be directed away from the vehicle's left to its right (see SAE J760). For structures within the vehicle that have a principal axis of motion such as the steering wheel and column, the vehicle coordinate system may be rotated about the y-axis such that the positive x-axis is directed along the column axis.
7.3 Dummy Coordinate Systems—Coordinate systems can be affixed to any point on the dummy. To determine the orientation of the coordinate axes, the dummy will always be considered as standing erect. For this posture, the positive y-axis will be directed from the dummy's left to its right side, the positive z-axis will be directed downward from head to toe, and the positive x-axis will be directed forward. In anatomical terminology, the positive x-axis is directed from the posterior to the anterior (P-A), the positive y-axis is directed from the left to right (L-R), and the positive z-axis is directed from superior to inferior (S-I). Figure 4 shows examples of this standardized orientation for coordinate systems attached to a few body points. Note that as the dummy is articulated to sit in a vehicle or if the dummy is articulated for a test, the coordinate systems rotate with their respective dummy parts.
7.4 Polarities of Acceleration, Velocity, and Displacement—Positive recorded outputs for these transducers are to be consistent with the positive axes of the coordinate system defined for the specific dummy or vehicle point being measured. For example, a blow to the back of the dummy's head produces an acceleration in the forward direction (+x) which should be recorded as a positive acceleration. A blow to the top of the head produces a +z acceleration. A blow to the left side of the head produces a +y acceleration.
9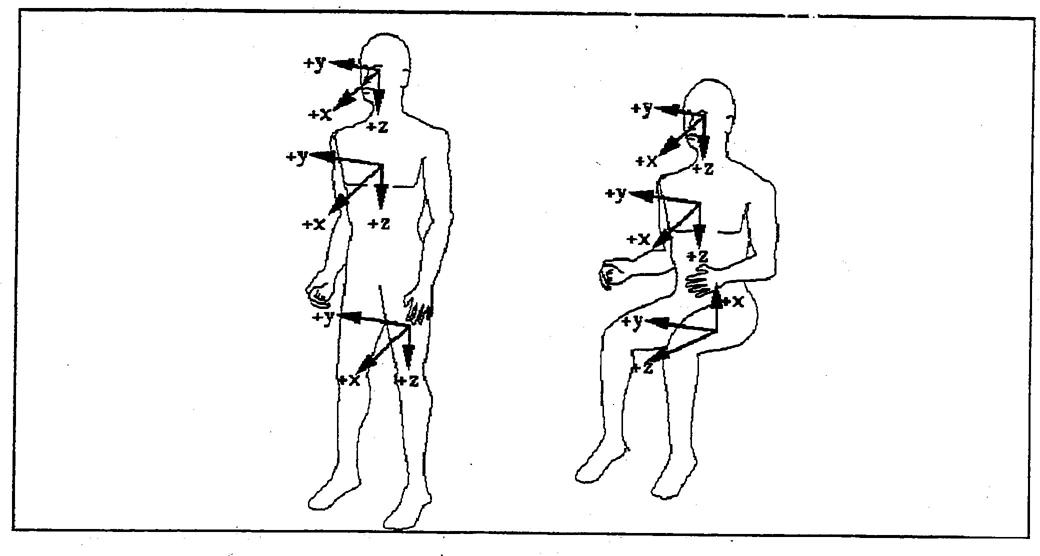
FIGURE 4—ORIENTATIONS OF STANDARDIZED DUMMY COORDINATE SYSTEMS FOR STANDING AND SEATED POSTURES
For displacements, the coordinate systems of interest must be defined. For example, frontal chest compression is the distance that the sternum moves relative to the thoracic spine. In this case, the coordinate system is fixed to the thoracic spine. When the sternum moves closer to the spine, its displacement is rearward relative to the spine which is in the negative x-direction. Hence, the polarity for frontal chest compression is negative. For lateral chest compression, a blow to the left side of the chest produces a positive displacement of the impacted ribs relative to the thoracic spine. However, a blow to the right side of the chest produces a negative rib displacement. The rearward displacement of the tibia relative to the femur that is measured by the knee shear transucer is in the negative x-direction. The polarity for this motion should be negative.
7.5 Polarities of Measured External Loads—For load cells that measure loads applied directly to the dummy or vehicle structure, their recorded output polarities should be consistent with the direction of the applied external load referenced to the standardized coordinate system at the point of the load application. For example, load cells that measure should belt loading of the clavicle are designed to measure Fx and Fz applied to the clavicle. Positive directions for these applied forces would be forward (+x) and downward (+z) relative to the dummy, respectively. For the BIOSID, a lateral inward load applied to the crest of the left illum would be positive (+y), while a lateral inward load applied to the crest of the right illum would be negative (−y).
107.6 Polarities of Measured Internal Loads—Defining recorded output polarities for load cells that measure loads internal to the dummy requires a standardized dummy sectioning scheme and a definition of what sectioned dummy part is to be loaded in the positive direction since internal loads occur in pairs of equal magnitudes but opposite directions. The standardized sectioning scheme is illustrated by the free-body diagram of a cube shown in Figure 5. It is assumed that the load cell of interest is contained within the cube and responds to loads applied to the surfaces of the cube. Load cell outputs should be recorded with positive polarities when normal loads, shear loads, torques, or moments are applied in the positive direction, as defined by the standardized coordinate system, to the right, front, and/or bottom surfaces of the cube. These loads are represented by solid arrows. For static equilibrium, equal magnitude but opposite (negative) direction loads must be applied to the left, back, and/or top surfaces of the cube as indicated by the dashed arrows. For example, upper and lower neck, lumbar spine, and upper and lower tibia load cells should have positive recorded outputs when the dummy is sectioned below the load cell in question and positive loads are applied to the bottom surface of the load cell in question. Free-body diagrams showing the load systems that produce the required recorded polarities for specific dummy load cells are given in the appropriate dummy users manual and in SAE J1733.
7.7 Dummy Manipulations for Checking Polarities of Measured Loads—Table 2 contains descriptions of dummy manipulations and the corresponding polarities for recorded outputs for some of the more common load cells used in dummies. Manipulations for checking polarities of load cells not listed in Table 2 may be found in the users manual for the specific dummy being used or SAE J1733.
8. Recording
8.1 Analog Magnetic Recorder—Tape speed should be stable to within less than 0.5% of the tape speed used. The signal-to-noise ratio of the recorder should not be less than 42 dB at the maximum tape speed.
The total harmonic distortion should be less than 3% and the linearity error should be less than 1% of the measurement range.
It is suggested that standard tape speeds be used: 15/16, 1-7/8, 3-3/4, 7.5, 15, 30, 60, 120 ips. Conformance to Inter-Range Instrumentation Group (IRIG) specifications is desirable.
8.2 Digital Magnetic Recorder—Tape speed should be stable to within less than 10% of the tape speed used. It is suggested that standard tape speeds be used: 75 or 100 ips. Tapes should be 0.5 in wide and recorded at standard 800, 1600, or 6250 bpi on 7 or 9 track formats.
8.3 Paper Tape Recorder—In the case of direct data recording, the paper speed in millimeters per second should be at least 1.5 times the number expressing FH in Hz.
In other cases, the paper speed should be such that an equivalent resolution should be obtained.
9. Digital Data Processing—This section establishes guidelines for digital data processing equipment used by crash testing agencies.
11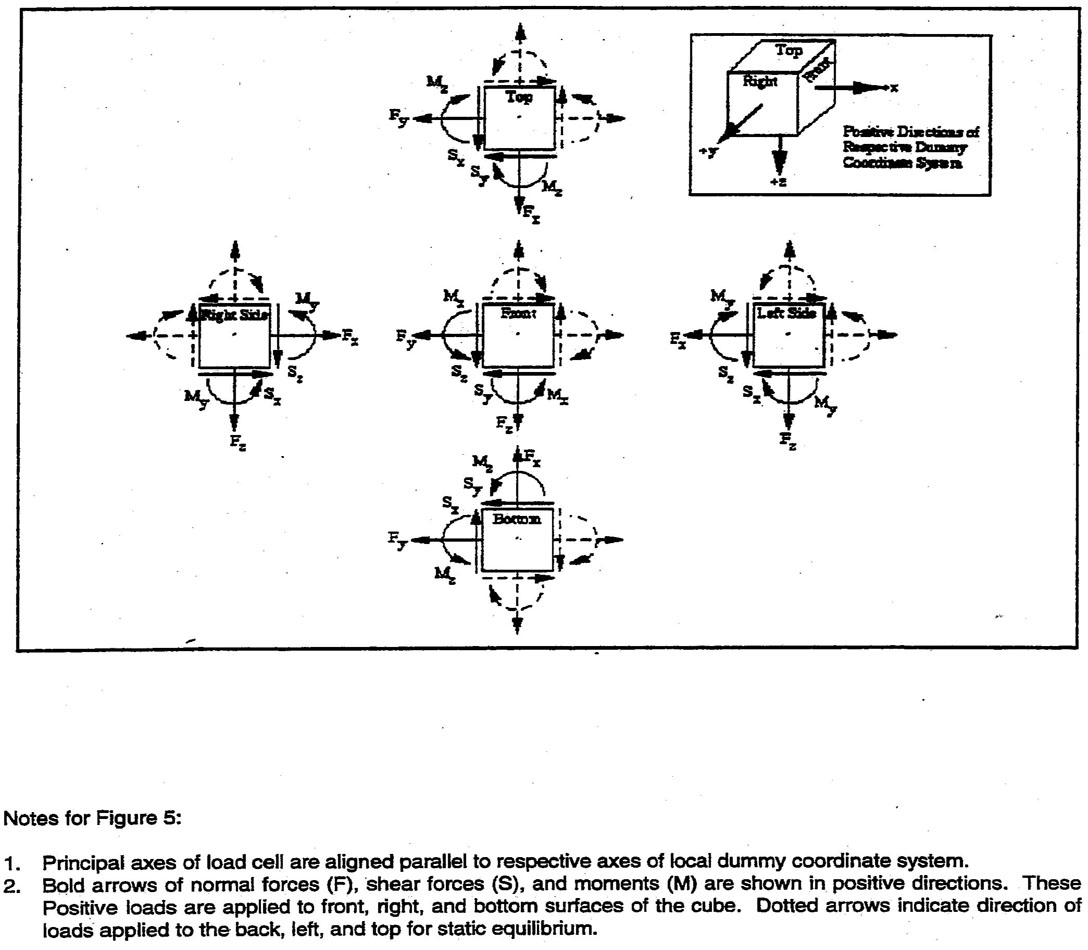
FIGURE 5—DIRECTIONS OF LOAD APPLIED TO FREE-BODY DIAGRAM OF THE SECTIONED DUMMY PART CONTAINING THE LOAD CELL OF INTEREST (ILLUSTRATED AS A CUBE) FOR POSITIVE RECORDED POLARITIES
12| Load Cell | Measure | Dummy Manipulations | Polarity |
|---|---|---|---|
| Upper and lower neck loads |
Fx | Head rearward, chest forward | + |
| Fy | Head leftward, chest rightward | + | |
| Fz | Head upward, chest downward | + | |
| Mx | Left ear toward left shoulder | + | |
| My | Chin toward sternum | + | |
| Mz | Chin toward left shoulder | + | |
| Left shoulder loads (BIOSID) |
Fx | Left shoulder forward, chest reaward | + |
| Fy | Left shoulder rightward, chest leftward | + | |
| Fz | Left shoulder downward, chest upward | + | |
| Right shoulder loads (BIOSID) |
Fx | Right shoulder forward, chest rearward | + |
| Fy | Right shoulder rightward, chest leftward | + | |
| Fz | Right shoulder downward, chest upward | + | |
| Clavicle loads |
Fx | Shoulder forward, chest rearward | + |
| Fz | Shoulder downward, chest rearward | + | |
| Upper and lower lumbar spine |
Fx | Chest rearward, pelvis forward | + |
| Fy | Chest leftward, pelvis rightward | + | |
| Fz | Chest upward, pelvis downward | + | |
| Mx | Left shoulder toward left hip | + | |
| My | Stemum toward front of legs | + | |
| Mz | Right shoulder forward, left shoulder rearward | + | |
| Sacrum load (BIOSID) |
Fy | Left H-point pad leftward, chest rightward | + |
| Left illac load (BIOSID) |
Fy | Left illac rightward, chest leftward | + |
| Right iliac load (BIOSID) |
Fy | Left illac rightward, chest leftward | + |
| Public load (side impact) |
Fy | Right H-point pad leftward, left pad rightward | (-) |
| Crotch Belt loads |
Fx | public rearward, pelvis forward | (-) |
| Fz | public upward, chest downward | (-) | |
| Illac lap belt loads |
Fx | Upper illac spine rearward, chest forward | (-) |
| My | Upper illac spine rearward, chest forward | + | |
| Left side abdominal load (Eurosid-1) |
Fy | Left side of abdomen rightward, chest leftward | + |
| Right side abdominal load (Eurosid-1) |
Fy | Right side of abdomen leftward, chest rightward | (-) 13 |
| Femur loads (dummy in seated position, femurs horizontal) |
Fx | Knee upward, upper femur downward | + |
| Fy | Knee rightward, upper femur leftward | + | |
| Fz | knee forward, pelvis rearward | + | |
| Mx | Knee leftward, hold upper femur in place | + | |
| My | Knee upward, hold upper femur in place | + | |
| Mz | Tibia leftward, hold pelvis in place | + | |
| Knee clevis | Fz | Tibia downward, femur upward | + |
| Upper tibia loads | Fz | Tibia downward, femur upward | + |
| Mx | Ankle leftward, hold knee in place | + | |
| My | Ankle forward, bottom of knee clevis rearward | + | |
| Lower tibia loads | Fx | Ankle forward, knee rearward | + |
| Fy | Ankle rightward, knee leftward | + | |
| Fz | Ankle downward, knee upward | + | |
| Mx | Ankle leftward, hold knee upward | + | |
| My | Ankle forward, bottom of knee clevis rearward | + |
9.1 Presample Filtering—Filtering corresponding to the frequencies of the data channel class may be carried out during processing of data.
However, before recording, analog filtering at a higher level than CFC-1000 should take place in order to use at least 50% of the dynamic range of the recorder and to reduce the risk of high frequencies saturating the recorder. Since crash test data may have high-frequency components above the channel class FH, presample filtering should be used to keep these components from causing aliasing errors in the sampling process. The user is cautioned to examine the unfiltered data for signal overloads, since the filtering process can mask certain overload conditions. Digital filtering should be done only once per data channel; that is, do not digital filter a digitally filtered signal.
The maximum error induced by aliasing at the FH frequency shall not exceed 0.1% of the CAC.
9.2 Sampling Rate—The minimum acceptable sampling rate is a function of many variables, particularly sophistication of the reconstruction method used in the processing software. For those installations utilizing only simple reconstruction software, the sample rate should be a minimum of ten times the FH. In installations with Class 1000 presample filters, this corresponds to a minimum sampling rate of approximately 10 000 samples per second per channel. In the case of analog recording. when the recording and playback speeds are different, the sampling frequency can be divided by the speed ratio.
9.3 Resolution—Digital word lengths of at least 10 bits (including sign) should be used to be assured of reasonable accuracy in processing. In those systems in which the dynamic range of the data is less than 50% of the A/D converter full-scale, a higher resolution may be required. The least significant bit should correspond to approximately 0.2% of the CAC.
9.4 Data Processing—Processing software is typically used to scale and filter data, determine zero levels, perform mathematical operations, and prepare data plot formats.
149.4.1 DIGITAL FILTERING—Filtering may be either phase-shifting or phaseless. Phase-shifting filters will cause time offsets and phaseless filters will cause time uncertainty; either of which will cause problems in comparing data to film, and comparing data to data if the class filters are different. Filtering should precede all nonlinear operations, such as calculation of resultant vectors and injury indices. Any filtering algorithm can be used for CFCs 1000 or 600 as long as the results conform to the data channel performance requirements as given in Section 4. The type of digital filter used should be reported. For CFCs 180 or 60, the digital Butterworth filter described in Appendix C should be used.
9.4.2 SCALING AND ZEROING—Software should be used to determine zero levels and calibration factors rather than relying on set gains and expecting no zero drift. Zero offset errors in orthogonal components cause comparable errors in resultant computation that are often difficult to detect.
9.4.3 INJURY INDEX CALCULATIONS—Injury index calculations should use all sampled data points. Details on various injury index calculations can be found in SAE J1727.
10. Timing Marks—Timing marks are essential in data analysis and correlation of high-speed film to other data channels. Timing frequency error should be less than 1% of the chosen or designated frequency. Timing synchronization should be within ± 1 ms.
11. Time of Contact—Time of initial contact (real or simulated) should be known within ± 1 ms and can be accomplished by recording a switch actuated by the impact or by observing the instant the test acceleration exceeds a predetermined value (for example, 0.5 G). It should also be recorded in film data through strobe lights or timing mark channels.
12. Presentation of Results—In reporting results of tests, the following information should be provided with data tabulations, time history traces, etc.:
- The data channel designations
- Description of designated reference points and locations of vehicle accelerations
- Transducer mounting analysis, if required by Section 6
- Type of digital filter used
- Method of combining subsystems for calibration
- Inertial coordinate systems definition
The results should be presented on A4 (210 mm X 297 mm) size paper (ISO 216) or 8.5 in X 11 in paper. Results presented as diagrams should have axes scaled with one measurement unit corresponding to a suitable multiple of the chosen unit (for example, 1,2,5,10, 20 mm). SI units shall be used, except for vehicle velocity where kilometers per hour may be used and for accelerations due to an impact where G may be used (with G = 9.81 m/s/s).
13. Standardization of Digital Date—For purposes of digital data exchange it is recommended that the NHTSA Formats for Data Exchange be followed. The documentation for this format is available for a nominal fee through the Office of Crashworthiness Research (NHTSA) (202-366-4850). The title of the documentation is NHTSA Data Tape Reference Guide (Version 4): Volume 1 - Vehicle Tests, Volume 2 - Biomechanics, Volume 3-Components, and Volume 4- Signal Waveform Generator.
14. Notes
14.1 Marginal Indicia—The change bar (1) located in the left margin is for the convenience of the user in locating areas where technical revisions have been made to the previous issue of the report. An (R) symbol to the left of the document title indicates a complete revision of the report.
PREPARED BY THE SAE SAFETY TEST INSTRUMENTATION STANDARDS COMMITTEE
15A.1 Impact Velocity—This can be calculated by measuring the time required to traverse a known distance prior to impact. Determination of impact velocity should be with an error of less than 1% of the actual velocity.
A.2 Test Specimen Crush
A.2.1 Residual Crush—Residual crush is specified by one or more single-valued data points, with respect to designated reference points. Determination of residual crush should be with an error of less than 5% of the actual crush.
A.2.2 Dynamic Crush—Maximum dynamic crush is a measurement of the maximum deformation of the test specimen during the impact. This is also measured with respect to one or more designated reference points. Contingent on the size of the specimen and the magnitude of the expected dynamic crush, the following are possible measurement methods:
- High-speed motion picture photography
- Double integration of acceleration data
- Use of a specific displacement transducer
The error should be less than 5% of the actual crush.
A.3 Steering Column Displacement—Displacements relative to designated reference points on the vehicle can be measured by various techniques. The coordinate system in which displacement is measured should be indicated. Determination of steering column displacement should be accurate to ±0.5 in (±1.27 cm).
A.4 References—Information pertaining to the justification of some of the specified filter frequency classes is contained in the minutes of the SAE Safety Test Instrumentation Subcommittee meetings held on April 16, September 24, November 21, 1986, and June 25, 1993.
16B.1 Transducer selection is a primary concern in the process of selecting a data channel configuration. Furthermore, the variety of transducers, within a transducer category, i.e., acceleration, pressure, force, displacement, etc., is ever widening, yielding concern regarding equivalence and/or correlation of various transducer performances for any specific application. As the transducer forms an integral part of the data channel, the error contribution of transducer related factors should be included when considering overall data channel performance requirements as outlined in Section 4.
17The purpose of SAE J211 is to recommend “techniques of measurement used in impact tests” which “will provide a basis for meaningful comparison of test results from different sources.” This is the goal of establishing equivalency of performance for various transducer types. Such a goal, considered relative to a transducer category, requires thorough knowledge of the measurement objective and its environment. It is not necessarily limited by technological constraints of transducer fabrication or design but is unmistakably linked to both the transient and steady responses under impact loading conditions.
Both steady-state and transient transducer responses depend on the combined performance of the transducer characteristics or specifications. Interaction of transducer characteristics can precipitate significant differences in both steady-state and transient responses between transducers with similar specifications. The user must ascertain combined performance to establish equivalence.
Potential sources of transducer errors are related to data channel compatibility (i.e., transducer may adversely interact with the remainder of the data channel upstream of the anti-aliasing filter), e.g., resonance/damping influences. Other sources of errors are related to environmental compatibility, i.e., nonmeasurement influences and interactions, which encompass temperature drift, magnetic and electric fields effects, etc., and transducer size, weight, seismic mass location, transverse sensitivity, gage creep, etc. As such, the user must ascertain data channel and environmental compatibility when establishing equivalence.
To establish equivalence, it is the user's responsibility to perform the tests necessary to ensure that the transducers under consideration yield similar results for the application of interest, within the error tolerances recommended by SAE J211 for the whole data channel.
The user should consider steady-state and dynamic calibration techniques duplicating spectral content representative of the target measurement application as a minimal initial basis for equivalence. The user should consider spectral content up to at least twice the frequency cutoff (FN, Figure 1) of the CFC for an amplitude of at least one half of the CAC in the comparative calibration. The amplitude response differences between the transfer functions of the two transducers should not exceed 0.5 dB over the same frequency range. The phase delay should fall within the data channel requirement as outlined in 4.3. The user should also consider using the transducers back-to-back and/or side-by-side in component level tests that are representative of actual test conditions and that simulate the frequency content of the CFC of the applications of interest.
If feasible, to verify equivalence, transducers may be used back-to-back and/or side-by-side in actual test conditions for a given measurement application. A statistically significant number of tests should be performed to validate the results. This method also may be used if there are no calibration methods to validate the dynamic response of the transducer type in question.
C.1 A difference equation used for filtering a sequence of data samples results in an amplitude versus frequency response curve as shown in Figure C1. The difference equation in the time domain has the form:
18Y[t] = a0X[t] + a1X[t−1] + a2X[t−2] + b1Y[t−1] + b2Y[t−2] (Eq. C1)
where:
X[t] is the input data stream
Y[t] is the filtered output data stream
a0, a1, a2, b1, b2 are constants dependent on the CFC as shown as follows:
T = Sample Period in Seconds
wd = 2* || * CFC * 2.0775
wa = sin(wd * T/2)/cos(wd * T/2)
ao = wa2/(1.0 + √2 * wa + wa2
a1 = 2 * ao
a2 = ao
b1 = −2 * (wa2 − 1) / (1 + √2 * wa + wa2)
b2 = (−1+√2 * wa − wa2)/(1 + √2 * wa + wa2)
Equation C1 is for a 2-pole filter. To make a 4-pole filter, the data are passed through the filter twice. By passing the data through the filter forward and then backward the filter will not phase shift the data. Peaks in the filtered data set will occur at the same time as peaks in the unfiltered data. However, if the data set contains a step or fast rise, the filtered output will contain data prior to and after the actual event in the unfiltered data. This can be seen in the pulse response of the filter shown in Figure C2. The filter will yield the same results if the data are passed through forward and then backward or if the data are passed through backward and then forward. It is up to the user to determine which method (forward/backward or backward/forward) is easiest to implement on their data reduction system.
Startup of the digital filter yields the same response as switching a signal into the input of an analog filter. The digital filter algorithm sees nonzero initial data as a step function, and it responds with a typical underdamped second-order response. If the data set to be filtered contains sufficient pre-event and post-event data, then the initial conditions can be ignored because the filter response to the initial step input will have damped out before the event begins.
If pre-event data are not available then special techniques must be applied to eliminate the filter start-up effects from the filtered data set. The filtered data trace can be forced to start at zero amplitude or it can be forced to match the magnitude of the first unfiltered sample point. This can be done by copying at least 10 ms of data after the starting point and transposing the copied data about the time and magnitude axes, either about the (0,0) coordinate point as shown in Figure C3, or about the first data point as shown in Figure C4. The same techniques are used at the end of the data set. The padded data set is then passed through the filter equation and then the extra points at the ends are thrown out.
Other algorithms may be developed by the user to handle the filter start-up. It is up to the user to select the most appropriate start-up algorithm, acknowledging additional distortion effects, for their data acquisition system and the types of data that are being processed. If pre-event data are not available, the start-up algorithm used must be reported.
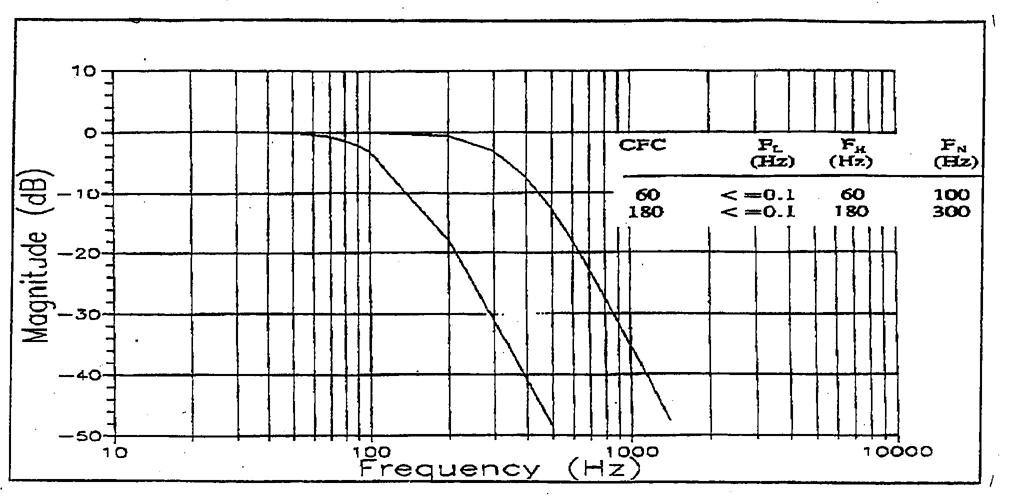
FIGURE C1—FREQUENCY RESPONSE CURVES FOR CLASS 60 AND 180 4-POLE PHASELESS BUTTERWORTH FILTER
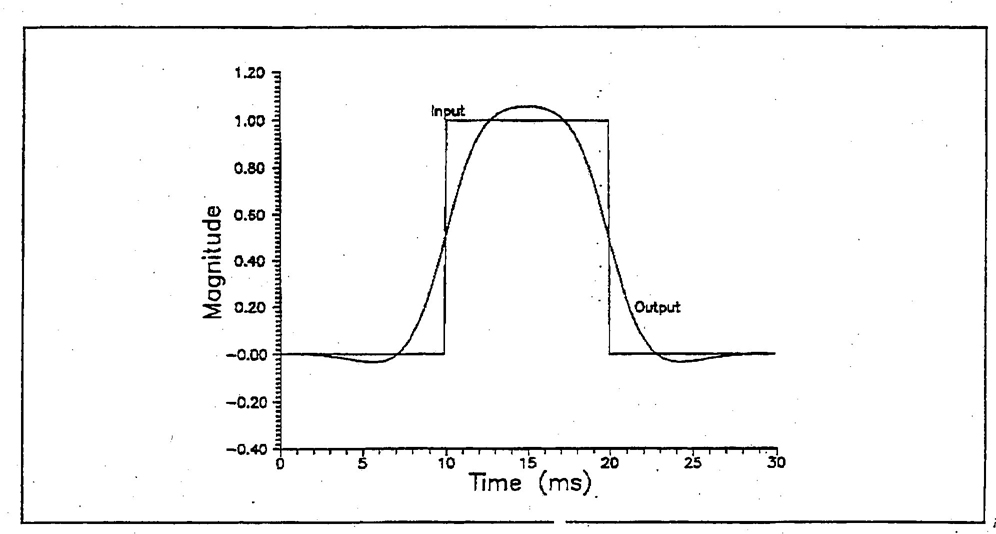
FIGURE C2—FILTER PULSE RESPONSE
19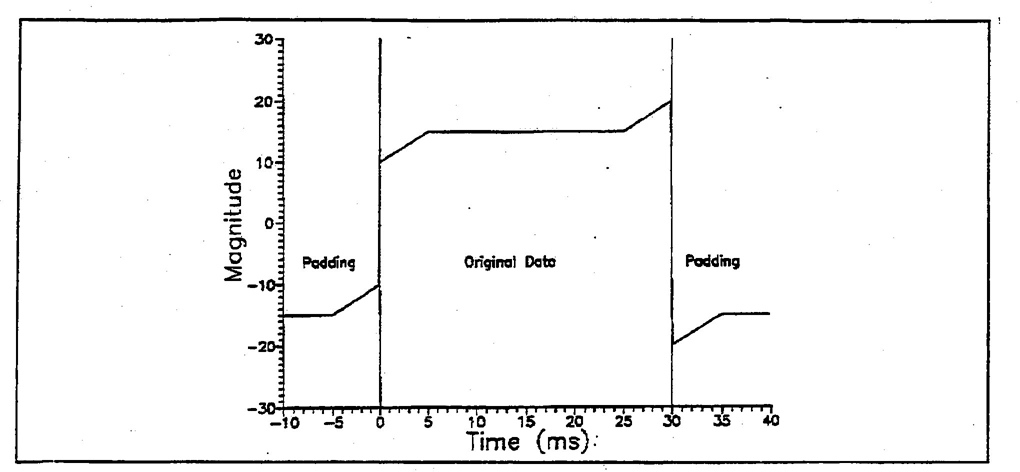
FIGURE C3—DATA TRANSPOSED ABOUT ZERO MAGNITUDE AXIS AND BEGINNING AND END TIME POINTS
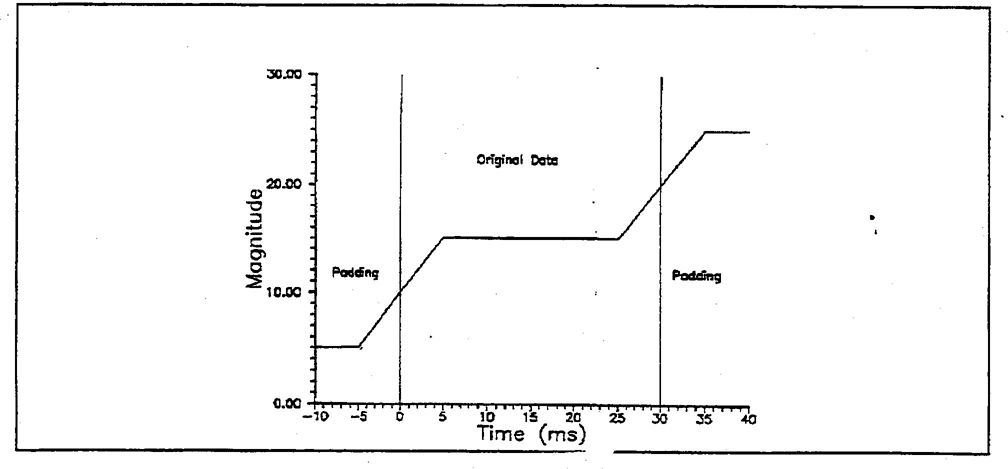
FIGURE C4—DATA TRANSPOSED ABOUT END POINTS
20Rationale—Not applicable.
Relationship of SAE Standard to ISO Standard—Not applicable.
Application—This SAE Recommended Practice outlines a series of performance recommendations which concern the whole data channel. These recommendations are not subject to any variation and all of them should be adhered to by any agency conducting tests to this practice. However, the method of demonstrating compliance with the recommendations is flexible and can be adapted to suit the needs of the particular equipment the agency is using.
It is not intended that each recommendation be taken in a literal sense, as necessitating a single test to demonstrate that the recommendation is met. Rather, it is intended that any agency proposing to conduct tests to this document should be able to demonstrate that if such a single test could be and were carried out, then their equipment would meet the recommendations. This demonstration should be undertaken on the basis of reasonable deductions from evidence in their possession, such as the results of partial tests.
In some systems it may be necessary to divide the whole channel into subsystems, for calibration and checking purposes. The recommendations have been written only for the whole channel, as this is the sole route by which subsystem performances affect the quality of the output. If it is difficult to measure the whole channel performance, which is usually the case, the test agency may treat the channel as two or more convenient subsystems. The whole channel performance could then be demonstrated on the basis of subsystem results, together with a rationale for combining the subsystem results together.
SAE J211-1 covers electronic instrumentation and SAE J211-2 covers photographic instrumentation.
Reference Section
SAE J670—Vehicle Dynamics Terminology
SAE J1727—Injury Calculation Guidelines
SAE J1733—Sign Convention for Vehicle Crash Testing
SAE Paper 930100
Minutes of the SAE Safety Test Instrumentation Subcommittee meetings held on April 16, September 24, November 21, 1986, and June 25, 1993
NHTSA Data Tape Reference Guide (Version 4): Volume 1-Vehicle Tests, Volume 2-Biomechanics, Volume 3-Components, and Volume 4-Signal Waveform Generator
Developed by the SAE Safety Test Instrumentation Standards Committee
21 22 23 24