In order to promote public education and public safety, equal justice for all, a better informed citizenry, the rule of law, world trade and world peace, this legal document is hereby made available on a noncommercial basis, as it is the right of all humans to know and speak the laws that govern them.
18TH EDITION 1992
Prepared and published jointly by:
AMERICAN PUBLIC HEALTH ASSOCIATION
AMERICAN WATER WORKS ASSOCIATION
WATER ENVIRONMENT FEDERATION
Joint Editorial Board
Arnold E. Greenberg, APHA, Chairman
Lenore S. Clesceri, WEF
Andrew D. Eaton, AWWA
Managing Editor
Mary Ann H. Franson
Publication Office
American Public Health Association
1015 Fifteenth Street, NW
Washington, DC 20005
Copyright © 1917, 1920, 1923, and 1925 by
American Public Health Association
Copyright © 1933, 1936, and 1946 by
American Public Health Association
American Water Works Association
Copyright © 1955, 1960, and 1965 by
American Public Health Association
American Water Works Association
Water Pollution Control Federation
Copyright © 1971 by
American Public Health Association
American Water Works Association
Water Pollution Control Federation
Copyright © 1976 by
American Public Health Association
American Water Works Association
Water Pollution Control Federation
Copyright © 1981 by
American Public Health Association
American Water Works Association
Water Pollution Control Federation
Copyright © 1985 by
American Public Health Association
American Water Works Association
Water Pollution Control Federation
Copyright © 1989 by
American Public Health Association
American Water Works Association
Water Pollution Control Federation
Copyright © 1992 by
American Public Health Association
American Water Works Association
Water Environment Federation
All rights reserved. No part of this publication may be reproduced, graphically or electronically, including entering in storage or retrieval systems, without the prior written permission of the publishers.
30M7/92
The Library of Congress has catalogued this work as follows:
American Public Health Association.
Standard methods for the examination of water and wastewater.
ISBN 0-87553-207-1
Printed and bound in the United States of America.
Composition: EPS Group, Inc., Hanover, Maryland
Set in: Times Roman
Printing: Victor Graphics, Inc., Baltimore, Maryland
Binding: American Trade Bindery, Baltimore, Maryland
Cover Design: DR Pollard and Associates, Inc., Arlington, Virginia
Determination of the common anions such as bromide, chloride, fluoride, nitrate, nitrite, phosphate, and sulfate often is desirable to characterize a water and/or to assess the need for specific treatment. Although conventional colorimetric, electrometric, or titrimetric methods are available for determining individual anions, only ion chromatography provides a single instrumental technique that may be used for their rapid, sequential measurement. Ion chromatography eliminates the need to use hazardous reagents and it effectively distinguishes among the halides (Br−, Cl−, and F−) and the oxy-ions (SO32−, SO42− or NO2−, NO3−).
This method is applicable, after filtration to remove particles larger than 0.2 µm, to surface, ground, and wastewaters as well as drinking water. Some industrial process waters, such as boiler water and cooling water, also may be analyzed by this method.
* Approved by Standard Methods Committee, 1990.
a. Principle: A water sample is injected into a stream of carbonate-bicarbonate eluent and passed through a series of ion exchangers. The anions of interest are separated on the basis of their relative affinities for a low capacity, strongly basic anion exchange (guard and separator columns). The separated anions are directed through a hollow fiber cation exchanger membrane (fiber suppressor) or micromembrane suppressor bathed in continuously flowing strongly acid solution (regenerant solution). In the suppressor the separated anions are converted to their highly conductive acid forms and the carbonate-bicarbonate eluent is converted to weakly conductive carbonic acid. The separated anions in their acid forms are measured by conductivity. They are identified on the basic of retention time as compared to standards. Quantitation is by measurement of peak area or peak height.
b. Interferences: Any substance that has a retention time coinciding with that of any anion to be determined and produces a detector response will interfere. For example, relatively high
4-1concentrations of low-molecular-weight organic acids interfere with the determination of chloride and fluoride by isocratic analyses. A high concentration of any one ion also interferes with the resolution, and sometimes retention, of others. Sample dilution or gradient elution overcomes many interferences. To resolve uncertainties of identification or quantitation use the method of known additions. Spurious peaks may result from contaminants in reagent water, glassware, or sample processing apparatus. Because small sample volumes are used, scrupulously avoid contamination. Modifications such as preconcentration of samples, gradient elution, or reinjection of portions of the eluted sample may alleviate some interferences but require individual validation for precision and bias.
c. Minimum detectable concentration: The minimum detectable concentration of an anion is a function of sample size and conductivity scale used. Generally, minimum detectable concentrations are near 0.1 mg/L for Br−, Cl−, NO3−, NO2−, PO43−, and SO42− with a 100-µL sample loop and a 10-µS/cm full-scale setting on the conductivity detector. Lower values may be achieved by using a higher scale setting and an electronic integrator.
d. Limitations: This method is not recommended for the determination of F− in unknown matrices. Equivalency studies have indicated positive or negative bias and poor precision in some samples. Two effects are common: first. F− is difficult to quantitate at low concentrations because of the major negative contribution of the “water dip” (corresponding to the elution of water); second, the simple organic acids (formic, carbonic, etc.) elute close to fluoride and will interfere. Determine precision and bias before analyzing samples. F− can be determined accurately by ion chromatography using special techniques such as dilute eluent or gradient elution using an NaOH eluent.
a. Ion chromatograph, including an injection valve, a sample loop, guard column, separator column, and fiber or membrane suppressors, a temperature-compensated small-volume conductivity cell and detector (6 µL or less), and a strip-chart recorder capable of full-scale response of 2 s or less. An electronic peak integrator is optional. Use an ion chromatograph capable of delivering 2 to 5 mL eluent/min at a pressure of 1400 to 6900 kPa.
b. Anion separator column, with styrene divinylbenzene-based low-capacity pellicular anion-exchange resin capable of resolving Br−, Cl−, NO3−, NO2−, PO43, and SO42−.*
c. Guard column, identical to separator column† to protect separator column from fouling by particulates or organics.
d. Fiber suppressor or membrane suppressor:‡ Cation-exchange membrane capable of continuously converting eluent and separated anions to their acid forms.
a. Deionized or distilled water free from interferences at the minimum detection limit of each constituent, filtered through a 0.2-µm membrane filter to avoid plugging columns, and having a conductance of < 0.1 µS/cm.
b. Eluent solution, sodium bicarbonate-sodium carbonate, 0.0017M NaHCO3-0.0018M Na2CO3: Dissolve 0.5712g NaHCO3 and 0.7632 g Na2CO3 in water and dilute to 4 L.
c. Regenerant solution, H2SO4, 0.025N: Dilute 2.8 mL cone H2SO4 to 4 L.
d. Standard anion solutions, 1000 mg/L: Prepare a series of standard anion solutions by weighing the indicated amount of salt, dried to a constant weight at 105°C, to 1000 mL. Store in plastic bottles in a refrigerator; these solutions are stable for at least 1 month. Verify stability.
| Anion§ | Salt | Amount g/L |
|---|---|---|
| Cl− | NaCl | 1.6485 |
| Br− | NaBr | 1.2876 |
| NO3− | NaNO3 | 1.3707 |
| NO2− | NaNO2 | 1.4998|| |
| PO43− | KH2PO4 | 1.4330 |
| SO42− | K2SO4 | 1.8141 |
| § Expressed as compound. | ||
| || Do not oven-dry, but dry to constant weight in a desiccator. | ||
e. Combined working standard solution, high range: Combine 12 mL of standard anion solutions, 1000 mg/L (¶ d) of NO2−, NO3−, HPO42−, and Br−, 20 mL of Cl−, and 80 mL of SO42−. Dilute to 1000 mL and store in a plastic bottle protected from light. Solution contains 12 mg/L each of NO2−, NO3−, HPO42−, and Br−, 20 mg/L of Cl−, and 80 mg/L of SO42−. Prepare fresh daily.
f. Combined working standard solution, low range: Dilute 25 mL of the high-range mixture (¶ e) to 100 mL and store in a plastic bottle protected from light. Solution contains 3 mg/L each of No2−, No3−, HPO42−, and Br−, 5mg/L Cl−, and 20 mg/L of SO42−. Prepare fresh daily.
g. Alternative combined working standard solutions: Prepare appropriate combinations according to anion concentration to be determined. If NO2− and PO43− are not included, the combined working standard is stable for 1 month. Dilute solutions containing NO2− and PO43− must be made daily.
a. System equilibration: Turn on ion chromatograph and adjust eluent flow rate to approximate the separation achieved in Figure 4110:0 (about 2 mL/min). Adjust detector to desired setting (usually 10 to 30 µS) and let system come to equilibrium (15 to 20 min). A stable base line indicates equilibrium conditions. Adjust detector offset to zero out eluent conductivity; with the fiber or membrane suppressor adjust the regeneration flow rate to maintain stability, usually 2.5 to 3 mL/min.
b. Calibration: Inject standards containing a single anion or a mixture and determine approximate retention times. Observed times vary with conditions but if standard eluent and anion separator column are used, retention always is in the order Cl−, NO2−, HPO42−, Br−, NO3−, and SO42−. Inject at least three different concentrations for each anion to be measured and construct a calibration curve by plotting peak height or area against
* Dionex P/N 37041 or equivalent.
† Dionex P/N 37042 or equivalent.
‡ Dionex P/N 037072 (micro membrane—high capacity/low volume—suppressor) or equivalent.
4-2
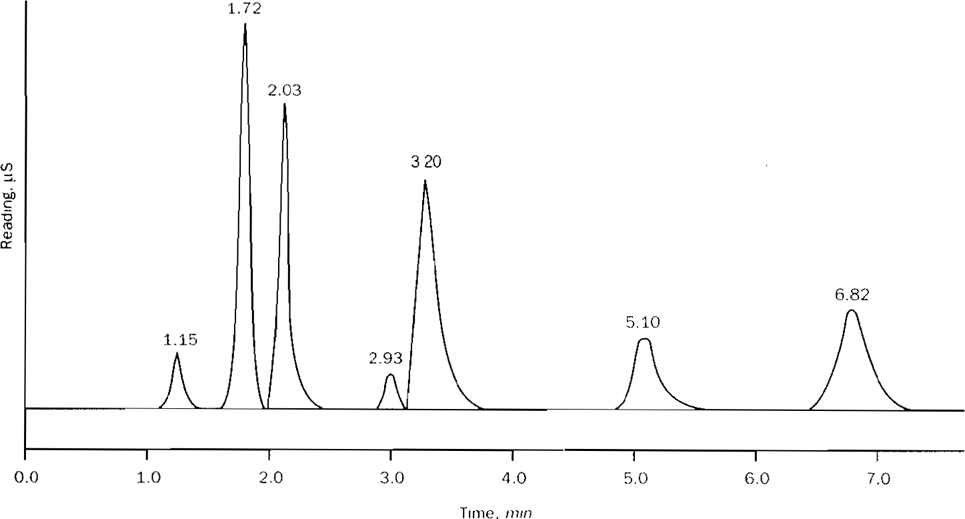
Figure 4110:1. Typical inorganic anion separation. Eluent: 1.7 mM NaHCO3, 1.8 mM Na2CO3; sample loop: 50 µL; flow:2.0 mL/min; column: Dionex AG4A plus AS4A.
| Anion | Time | Cone mg/L | Anion | Time | Cone mg/L |
|---|---|---|---|---|---|
| Fluoride | 1.15 | 2 | Nitrate | 3.20 | 10 |
| Chloride | 1.72 | 20 | Orthophosphate | 5.10 | 10 |
| Nitrite | 2.03 | 10 | Sulfate | 6.82 | 20 |
| Bromide | 2.93 | 5 |
concentration on linear graph paper. Recalibrate whenever the detector setting, eluent, or regenerant is changed. To minimize the effect of the “water dip” # on F− analysis, analyze standards that bracket the expected result or eliminate the water dip by diluting the sample with eluent or by adding concentrated eluent to the sample to give the same HCO3−/CO32− concentration as in the eluent. If sample adjustments are made, adjust standards and blanks identically.
If linearity is established for a given detector setting, single standard calibration is acceptable. Record peak height or area and retention time for calculation of the calibration factor, F. However, a calibration curve will result in better precision and bias. HPO42− is nonlinear below 1.0 mg/L.
c. Sample analysis: Remove sample particulates, if necessary, by filtering through a prewashed 0.2-µm-pore-diam membrane filter. Using a prewashed syringe of 1 to 10 mL capacity equipped with a male luer fitting inject sample or standard. Inject enough sample to flush sample loop several times: for 0.1 mL sample loop inject at least 1 mL. Switch ion chromatograph from load to inject mode and record peak heights and retention times on strip chart recorder. After the last peak (SO42−) has appeared and the conductivity signal has returned to base line, another sample can be injected.
Calculate concentration of each anion, in milligrams per liter, by referring to the appropriate calibration curve. Alternatively, when the response is shown to be linear, use the following equation:
C = H ×F × D
where:
C = mg anion/L,
H = peak height or area,
F = response factor = concentration of standard/height (or area) of standard, and
D = dilution factor for those samples requiring dilution.
See Section 4020 for minimum QC guidelines.
The data in Tables 4110:I through VII were produced in a joint validation study with EPA and ASTM participation. Nineteen laboratories participated and used known additions of six prepared concentrates in three waters (reagent, waste, and drinking) of their choice.
# Water dip occurs because water conductivity in sample is less than eluent conductivity (eluent is diluted by water).
4-3| Water | Amount Added mg/L |
Amount Found mg/L |
St | So | Bias % |
|---|---|---|---|---|---|
| Reagent | 0.26 | 0.25 | 0.08 | 0.11 | −3.8 |
| 0.34 | 0.29 | 0.11 | −14.7 | ||
| 2.12 | 2.12 | 0.07 | 0.12 | 0.0 | |
| 2.55 | 2.48 | 0.14 | −2.7 | ||
| 6.79 | 6.76 | 0.20 | 0.19 | −0.4 | |
| 8.49 | 8.46 | 0.30 | −0.4 | ||
| Drinking | 0.26 | 0.24 | 0.08 | 0.05 | −7.7 |
| 0.34 | 0.34 | 0.11 | 0.0 | ||
| 2.12 | 2.09 | 0.18 | 0.06 | −1.4 | |
| 2.55 | 2.55 | 0.16 | 0.0 | ||
| 6.79 | 6.84 | 0.54 | 0.25 | +0.7 | |
| 8.49 | 8.37 | 0.75 | −1.4 | ||
| Waste | 0.26 | 0.25 | 0.15 | 0.06 | −3.8 |
| 0.34 | 0.32 | 0.08 | −5.9 | ||
| 2.12 | 2.13 | 0.22 | 0.15 | +0.5 | |
| 2.55 | 2.48 | 0.16 | −2.7 | ||
| 6.79 | 6.65 | 0.41 | 0.20 | −2.1 | |
| 8.49 | 8.27 | 0.36 | −2.6 | ||
| Source: American Society for Testing and Materials. 1992. Method D4327. Annual Book of ASTM Standards, Vol. 11.01 Water. American Soc. Testing & Materials. Philadelphia. Pa. | |||||
| Water | Amount Added mg/L | Amount Found mg/L | St | So | Bias % |
|---|---|---|---|---|---|
| Reagent | 0.78 | 0.79 | 0.17 | 0.29 | +1.3 |
| 1.04 | 1.12 | 0.46 | +7.7 | ||
| 6.50 | 6.31 | 0.27 | 0.14 | −2.9 | |
| 7.80 | 7.76 | 0.39 | −0.5 | ||
| 20.8 | 20.7 | 0.54 | 0.62 | −0.5 | |
| 26.0 | 25.9 | 0.58 | −0.4 | ||
| Drinking | 0.78 | 0.54 | 0.35 | 0.20 | −30.8 |
| 1.04 | 0.51 | 0.38 | −51.0 | ||
| 6.50 | 5.24 | 1.35 | 1.48 | −19.4 | |
| 7.80 | 6.02 | 1.90 | −22.8 | ||
| 20.8 | 20.0 | 2.26 | 1.14 | −3.8 | |
| 26.0 | 24.0 | 2.65 | −7.7 | ||
| Waste | 0.78 | 0.43 | 0.32 | 0.39 | −44.9 |
| 1.04 | 0.65 | 0.48 | −37.5 | ||
| 6.50 | 4.59 | 1.82 | 0.83 | −29.4 | |
| 7.80 | 5.45 | 2.02 | −30.1 | ||
| 20.8 | 18.3 | 2.41 | 1.57 | −11.8 | |
| 26.0 | 23.0 | 2.50 | −11.5 | ||
| Source: American Society for Testing and Materials. 1992. Method D4327. Annual Book of ASTM Standards. Vol. 11.01 Water. American Soc. Testing & Materials. Philadelphia, Pa. | |||||
| Water | Amount Added mg/L | Amount Found mg/L | St | So | Bias % |
|---|---|---|---|---|---|
| Reagent | 0.36 | 0.37 | 0.04 | 0.04 | +2.8 |
| 0.48 | 0.48 | 0.06 | 0.0 | ||
| 3.00 | 3.18 | 0.12 | 0.06 | +6.0 | |
| 3.60 | 3.83 | 0.12 | +6.4 | ||
| 9.60 | 9.84 | 0.36 | 0.26 | +2.5 | |
| 12.0 | 12.1 | 0.27 | +0.6 | ||
| Drinking | 0.36 | 0.30 | 0.13 | 0.03 | −16.7 |
| 0.48 | 0.40 | 0.14 | −16.7 | ||
| 3.00 | 3.02 | 0.23 | 0.12 | +0.7 | |
| 3.60 | 3.62 | 0.22 | +0.6 | ||
| 9.60 | 9.59 | 0.44 | 0.28 | −0.1 | |
| 12.0 | 11.6 | 0.59 | −3.1 | ||
| Waste | 0.36 | 0.34 | 0.06 | 0.04 | −5.6 |
| 0.48 | 0.46 | 0.07 | −4.2 | ||
| 3.00 | 3.18 | 0.13 | 0.10 | +6.0 | |
| 3.60 | 3.76 | 0.18 | 0.10 | +4.4 | |
| 9.60 | 9.74 | 0.49 | 0.26 | +1.5 | |
| 12.0 | 12.0 | 0.56 | +0.3 | ||
| Source: American Society for Testing and Materials. 1992. Method D4327. Annual Book of ASTM Standards, Vol. 11.01 Water. American Soc. Testing & Materials. Philadelphia, Pa. | |||||
| Water | Amount Added mg/L | Amount Found mg/L | St | So | Bias % |
|---|---|---|---|---|---|
| Water | 0.63 | 0.69 | 0.11 | 0.05 | +9.5 |
| 0.84 | 0.85 | 0.12 | +1.2 | ||
| 5.24 | 5.21 | 0.22 | 0.21 | −0.6 | |
| 6.29 | 6.17 | 0.35 | −1.9 | ||
| 16.8 | 17.1 | 0.70 | 0.36 | +1.6 | |
| 21.0 | 21.3 | 0.93 | +1.5 | ||
| Drinking | 0.63 | 0.63 | 0.13 | 0.04 | 0.0 |
| 0.84 | 0.81 | 0.13 | −3.6 | ||
| 5.24 | 5.11 | 0.23 | 0.13 | −2.5 | |
| 6.29 | 6.18 | 0.30 | −1.7 | ||
| 16.8 | 17.0 | 0.55 | 0.57 | +0.9 | |
| 21.0 | 20.9 | 0.65 | −0.4 | ||
| Waste | 0.63 | 0.63 | 0.15 | 0.09 | 0.0 |
| 0.84 | 0.85 | 0.15 | +1.2 | ||
| 5.24 | 5.23 | 0.36 | 0.11 | −0.2 | |
| 6.29 | 6.27 | 0.46 | −0.3 | ||
| 16.8 | 16.6 | 0.69 | 0.43 | −1.0 | |
| 21.0 | 21.1 | 0.63 | +0.3 | ||
| Source: American Society for Testing and Materials. 1992. Method D4327. Annual Book of ASTM Standards, Vol. 11.01 Water. American Soc. Testing & Materials. Philadelphia, Pa. | |||||
| Water | Amount Added mg/L | Amount Found mg/L | St | So | Bias % |
|---|---|---|---|---|---|
| Reagent | 0.42 | 0.42 | 0.04 | 0.02 | 0.0 |
| 0.56 | 0.56 | 0.06 | 0.0 | ||
| 3.51 | 3.34 | 0.15 | 0.08 | −4.8 | |
| 4.21 | 4.05 | 0.28 | −3.8 | ||
| 11.2 | 11.1 | 0.47 | 0.34 | −1.1 | |
| 14.0 | 14.4 | 0.61 | +2.6 | ||
| Drinking | 0.42 | 0.46 | 0.08 | 0.03 | +9.5 |
| 0.56 | 0.58 | 0.09 | +3.6 | ||
| 3.51 | 3.45 | 0.27 | 0.10 | −1.7 | |
| 4.21 | 4.21 | 0.38 | 0.0 | ||
| 11.2 | 11.5 | 0.50 | 0.48 | +2.3 | |
| 14.0 | 14.2 | 0.70 | +1.6 | ||
| Waste | 0.42 | 0.36 | 0.07 | 0.06 | −14.6 |
| 0.56 | 0.40 | 0.16 | −28.6 | ||
| 3.51 | 3.19 | 0.31 | 0.07 | −9.1 | |
| 4.21 | 3.84 | 0.28 | −8.8 | ||
| 11.2 | 10.9 | 0.35 | 0.51 | −3.0 | |
| 14.0 | 14.1 | 0.74 | +0.4 | ||
| Source: American Society for Testing and Materials. 1992. Method D4327. Annual Book of ASTM Standards. Vol. 11.01 Water. American Soc. Testing & Materials. Philadelphia, Pa. | |||||
| Water | Amount Added mg/L | Amount Found mg/L | St | So | Bias % |
|---|---|---|---|---|---|
| Reagent | 0.69 | 0.69 | 0.06 | 0.06 | 0.0 |
| 0.92 | 0.98 | 0.15 | +6.5 | ||
| 5.77 | 5.72 | 0.36 | 0.18 | −0.9 | |
| 6.92 | 6.78 | 0.42 | −2.0 | ||
| 18.4 | 18.8 | 1.04 | 0.63 | +2.1 | |
| 23.1 | 23.2 | 0.35 | +0.4 | ||
| Drinking | 0.69 | 0.70 | 0.17 | 0.17 | +1.4 |
| 0.92 | 0.96 | 0.20 | +4.3 | ||
| 5.77 | 5.43 | 0.52 | 0.40 | −5.9 | |
| 6.92 | 6.29 | 0.72 | −9.1 | ||
| 18.4 | 18.0 | 0.68 | 0.59 | −2.2 | |
| 23.1 | 22.6 | 1.07 | −2.0 | ||
| Waste | 0.68 | 0.64 | 0.26 | 0.09 | −7.2 |
| 0.92 | 0.82 | 0.28 | −10.9 | ||
| 5.77 | 5.18 | 0.66 | 0.34 | −10.2 | |
| 6.92 | 6.24 | 0.74 | −9.8 | ||
| 18.4 | 17.6 | 2.08 | 1.27 | −4.1 | |
| 23.1 | 22.4 | 0.87 | −3.0 | ||
| Source: American Society for Testing and Materials. 1992. Method D4327. Annual Book of ASTM Standards, Vol. 11.01 Water. American Soc. Testing & Materials. Philadelphia, Pa. | |||||
| Water | Amount Added mg/L | Amount Found mg/L | St | So | Bias % |
|---|---|---|---|---|---|
| Reagent | 2.85 | 2.83 | 0.32 | 0.52 | −0.7 |
| 3.80 | 3.83 | 0.92 | +0.8 | ||
| 23.8 | 24.0 | 1.67 | 0.68 | +0.8 | |
| 28.5 | 28.5 | 1.56 | −0.1 | ||
| 76.0 | 76.8 | 3.42 | 2.33 | +1.1 | |
| 95.0 | 95.7 | 3.59 | +0.7 | ||
| Drinking | 2.85 | 1.12 | 0.37 | 0.41 | −60.7 |
| 3.80 | 2.26 | 0.97 | −40.3 | ||
| 23.8 | 21.8 | 1.26 | 0.51 | −8.4 | |
| 28.5 | 25.9 | 2.48 | −9.1 | ||
| 76.0 | 74.5 | 4.63 | 2.70 | −2.0 | |
| 95.0 | 92.3 | 5.19 | −2.8 | ||
| Waste | 2.85 | 1.89 | 0.37 | 0.24 | −33.7 |
| 3.80 | 2.10 | 1.25 | −44.7 | ||
| 23.8 | 20.3 | 3.19 | 0.58 | −14.7 | |
| 28.5 | 24.5 | 3.24 | −14.0 | ||
| 76.0 | 71.4 | 5.65 | 3.39 | −6.1 | |
| 95.0 | 90.3 | 6.80 | −5.0 | ||
| Source: American Society for Testing and Materials. 1992. Method D4327. Annual Book of ASTM Standards, Vol. 11.01 Water. American Soc. Testing & Materials. Philadelphia, Pa. | |||||
SMALL. H., T. STEVENS & W. BAUMAN. 1975. Novel ion exchange chromatographic method using conductimetric detection. Anal. Chem. 47:1801.
JENKE. D. 1981. Anion peak migration in ion chromatography. Anal. Chem. 53:1536.
BYNUM, M.I.. S. TYREE & W. WEISER. 1981. Effect of major ions on the determination of trace ions by ion chromatography. Anal. Chem. 53:1935.
WEISS, J. 1986. Handbook of Ion Chromatography. E. L. Johnson, ed. Dionex Crop., Sunnyvale, Calif.
PFAFF, J.D., C.A. BROCKHOFF & J.W. O’DELL. 1991. The Determination of Inorganic Anions in Water by Ion Chromatography. Method 300.0, U.S. Environmental Protection Agency, Environmental Monitoring Systems Lab., Cincinnati, Ohio.
4-5a. Principle: A small portion of a filtered, homogeneous, aqueous sample or a sample containing no particles larger than 0.45 µm is injected into an ion chromatograph. The sample merges with the eluent stream and is pumped through the ion chromatographic system. Anions are separated on the basis of their affinity for the active sites of the column packing material. Conductivity detector readings (either peak area or peak height) are used to compute concentrations.
b. Interferences: Any two species that have similar retention times can be considered to interfere with each other. This method has potential coelution interference between short-chain acids and fluoride and chloride. Solid-phase extraction cartridges can be used to retain organic acids and pass inorganic anions. The interference-free solution then can be introduced into the ion chromatograph for separation.
This method is usable but not recommended for fluoride. Acetate, formate, and carbonate interfere in determining fluoride under the conditions listed in Table 4110:VIII. Filtering devices may be used to remove organic materials for fluoride measurements; simultaneously, use a lower eluent flow rate.
Chlorate and bromide coelute under the specified conditions. Determine whether other anions in the sample coelute with the anions of interest.
Additional interference occurs when anions of high concentrations overlap neighboring anionic species. Minimize this by sample dilution with reagent water.
Best separation is achieved with sample pH between 5 and 9. When samples are injected the eluent pH will seldom change unless the sample pH is very low. Raise sample pH by adding a small amount of a hydroxide salt to enable the eluent to control pH.
Because method sensitivity is high, avoid contamination by reagent water and equipment. Determine any background or interference due to the matrix when adding the QC sample into any matrix other than reagent water.
c. Minimum detectable concentration: The minimum detectable concentration of an anion is a function of sample volume and the signal-to-noise ratio of the detector-recorder combination. Generally, minimum detectable concentrations are about 0.1 mg/L for the anions with an injection volume of 100 µL. Preconcentrators or using larger injection volumes can reduce detection limits to nanogram-per-liter levels for the common anions. However, coelution is a possible problem with large injection volumes. Determine method detection limit for each anion of interest.
d. Prefiltration: If particularly contaminated samples are run, prefilter before or during injection. If the guard column becomes contaminated, follow manufacturer’s suggestions for cleanup.
a. Ion chromatograph, complete with all required accessories including syringes, analytical columns, gases, detector, and a data system. Required accessories are listed below.
| Anion | Retention Time min | MDL†1 mg/L | |||
|---|---|---|---|---|---|
| Cl− | 2.3 | 0.035 | |||
| NO2− | 3.1 | 0.022 | |||
| Br− | 4.2 | 0.110 | |||
| NO3− | 5.3 | 0.035 | |||
| PO43− | 5.7 | 0.110 | |||
| SO42− | 8.3 | 0.350 | |||
| * Standard conditions as defined in text. | |||||
| † MDL calculated from the peak height in mm taken from chart recorder. | |||||
b. Filter device, 0.45µm, placed before separator column to protect it from fouling by particulates or organic constituents. †
c. Anion separator column, packed with low-capacity anion-exchange resin capable of resolving fluoride, chloride, nitrite, bromide, nitrate, orthophosphate, and sulfate.‡
d. Conductivity detector, flow-through, with integral heat-exchange unit allowing automatic temperature control and with separate working and references electrodes.
e. Pump, constant flow rate controlled, high-pressure liquid chromatographic type, to deliver 1.5 mL/min.
f. Data system, including one or more computer, integrator, or strip chart recorder compatible with detector output voltage.
g. Sample injector: Either an automatic sample processor or a manual injector. If manual injector is used, provide several glass syringes of > 200 µL capacity. The automatic device must be compatible and able to inject a minimum sample volume of 100 µL.
a. Reagent water: Distilled or deionized water of 18 megohm-cm resistivity containing no particles larger than 0.20 µm.
b. Borate/gluconate concentrate: Combine 16.00 g sodium gluconate, 18.00 g boric acid, 25.00 g sodium tetraborate decahydrate, and 125 mL glycerin in 600 mL reagent water. Mix and dilute to 1 L with reagent water.
c. Eluent solution, 0.110M borate, 0.0015M gluconate, 12% (v/v) acetonitrile: Combine 20 mL borate/gluconate concentrate, 120 mL HPLC-grade acetonitrile, and 20 mL HPLC-grade n-butanol, and dilute to 1 L with reagent water. Use an in-line filter before the separator column to assure freedom from particulates. If the base line drifts, degas eluent with an inert gas such as helium or argon.
d. Stock standard solutions: See 4110B.3e.
e. Combined working standard solutions, high-range: See 4110B.3e.
f. Combined working standard solutions, low-range: See 4110B.3f.
* Approved by Standard Methods Committee, 1991.
† Waters P/N 84560 or equivalent.
‡ Waters P/N 07355 or equivalent.
4-6