This library of books, audio, video, and other materials from and about India is curated and maintained by Public Resource. The purpose of this library is to assist the students and the lifelong learners of India in their pursuit of an education so that they may better their status and their opportunities and to secure for themselves and for others justice, social, economic and political.
This item has been posted for non-commercial purposes and facilitates fair dealing usage of academic and research materials for private use including research, for criticism and review of the work or of other works and reproduction by teachers and students in the course of instruction. Many of these materials are either unavailable or inaccessible in libraries in India, especially in some of the poorer states and this collection seeks to fill a major gap that exists in access to knowledge.
For other collections we curate and more information, please visit the Bharat Ek Khoj page. Jai Gyan!
Indian Roads Congress
Special Publication 28
(FIRST REVISION)
Published by
The Indian Roads Congress
Copies can be had from The Secretary,
Indian Roads Congress,
Jamnagar House,
Shahjahan Road,
New Delhi-110 011
NEW DELHI Price Rs.100/-
(Plus Packing & Postage )
MEMBERS OF THE HIGHWAYS SPECIFICATIONS AND STANDARDS COMMITTEE
(AS ON 8.11.93)
| 1. | D.P. Gupta (Convenor) |
- | Addl. Director General (Roads), Ministry of Surface Transport (Roads Wing), New Delhi |
| 2. | P.K. Dutta (Member-Secretary) |
- | Chief Engineer (Roads), Ministry of Surface Transport (Roads Wing), New Delhi |
| 3. | G.R. Ambwani | - | Engineer-in-Chief, Municipal Corporation of Delhi |
| 4. | S.R. Agrawal | - | General Manager (R), Rail India Technical & Economic Services Ltd., New Delhi |
| 5. | V.K. Arora | - | Chief Engineer (Roads), Ministry of Surface Transport (Roads Wing), New Delhi |
| 6. | R.K. Banerjee | - | Engineer-in-Chief & Ex-Officio Secretary to Govt. of West Bengal |
| 7. | Dr. S. Raghava Chari | - | Professor, Transport Engg. Section, Deptt. of Civil Engg., Regional Engg. College, Warangal |
| 8. | Dr. M.P. Dhir | - | Director (Engg. Co-ordination), Council of Scientific & Industrial Research, New Delhi |
| 9. | J.K. Dugad | - | Chief Engineer (Retd.), 98A. MIG Flats, AD Pocket, Pitam Pura, New Delhi |
| 10. | Lt. Gen. M.S. Gosain | - | Shankar Sadan, 57/1, Hardwar Road, Dehradun |
| 11. | O.P. Goel | - | Director General (Works), C.P.W.D., New Delhi |
| 12. | D.K. Gupta | - | Chief Engineer (HQ), PWD, U.P. |
| 13. | Dr. A.K. Gupta | - | Professor & Coordinator, University of Roorkee, Roorkee |
| 14. | G. Sree Ramana Gopal | - | Scientist-SD, Ministry of Environment & Forest, New Delhi |
| 15. | H.P. Jamdar | - | Special Secretary to Govt. of Gujarat, Roads & Building Department, Gandhinagari |
| 16. | M.B. Jayawant | - | Synthetic Asphalts, 103. Pooja Mahul Road, Chembur, Bombay |
| 17. | V.P. Kamdar | - | Plot No. 23, Sector No. 19, Gandhinagar (Gujarat) |
| 18. | Dr. L.R. Kadiyali | - | Chief Consultant, S-487, IInd Floor, Greater Kailash-I, New Delhi |
| 19. | Ninan Koshi | - | Director General (Raod Development), Ministry of Surface Transport, (Roads Wing), New Delhi |
| 20. | P.K. Lauria | - | Secretary to Govt. of Rajasthan, Jaipur |
| 21. | N.V. Merani | - | Secretary (Retd.), Maharashtra PWD, A-47/1344, Adarash Nagar, Bombay |
| 22. | M.M. Swaroop Mathur | - | Secretary (Retd), Rajasthan PWD, J-22, Subhash Marg, C-Scheme, Jaipur |
| 23. | Dr. A.K. Mullick | - | Director General, National Council for Cement & Building Materials |
| 24. | Y.R. Phull | - | Deputy Director. CRRI, New Delhi |
| 25. | G. Raman | - | Deputy Director General. Bureau of Indian Standards |
| 26. | Prof. N. Ranganathan | - | Prof. & Head. Deptt. of Transport Planning. School of Planning & Architecture. New Delhi |
| 27. | P.J. Rao | - | Deputy Director & Head. Geotechnical Engg. Division. CRRI. New Delhi |
| 28. | Prof. G.V. Rao | - | Prof, of Civil Engg., Indian Institute of Technology, New Delhi |
| 29. | R.K. Saxena | - | Chief Engineer (Retd.) Ministry of Surface Transport. New Delhi |
| 30. | A. Sankaran | - | A-l, 7/2. 51, Shingrila. 22nd Cross Street. Besant Nagar. Madras |
| 31. | Dr. A.C. Sarna | - | General Manager (T&T), Urban Transport Division., RITES, New Delhi |
| 32. | Prof. C.G. Swaminathan | - | Director (Retd.), CRRI, Badri, 50, Thiruvankadam Street, R.A. Puram, Madras ii |
| 33. | G. Sinha | - | Addl. Chief Engineer (Plg.), PWD (Roads, Guwahati |
| 34. | A.R. Shah | - | Chief Engineer (QC) & Joint Secretary, R&B Deptt. |
| 35. | K.K. Sarin | - | Director General (Road Development) & Addl. Secretary to Govt. of India (Retd.) S-108, Panchsheel Park, New Delhi |
| 36. | M.K. Saxena | - | Director, National Institute for Training of Highway Engineers, New Delhi |
| 37. | A. Sen | - | Chief Engineer (Civil), Indian Road Construction Corp. Ltd., New Delhi |
| 38. | The Director | - | Highway Research Station, Madras |
| 39. | The Director | - | Central Road Research Institute, New Delhi |
| 40. | The President | - | Indian Roads Congress, (M. K. Agarwal) Engineer-in Chief, Haryana P.W.D.. B&R - Ex-Officio |
| 41. | The Director General | - | (Road Development). & Addl. Secretary to the Govt. of India (Ninan Koshi) - Ex-Officio |
| 42. | The Secretary | - | Indian Roads Congress (D.P. Gupta) - Ex-Officio |
| Corresponding Members | |||
| 1. | S.K. Bhatnagar | - | Deputy Director-Bitumen. Hindustan Petroleum Corp. Ltd. |
| 2. | Brig. C.T. Chari | - | Chief Engineer, Bombay Zone, Bombay |
| 3. | A. Choudhuri | - | Shalimar Tar Products. New Delhi |
| 4. | L.N. Narendra Singh | - | IDL Chemicals Ltd.. New Delhiiii |
ROAD TRANSPORT AND ENERGY
The publication on Road Transport and Energy, was first printed in 1984. As the data included therein had become outdated, the Transport Planning Committee of Indian Roads Congress had taken up the revision of this publication. The draft of revised Manual was considered by the Transport Planning Committee (personnel given below) in its meeting held at Patna on 28th November, 1992 and approved subject to certain modifications suggested by members.
| Dr. L.R. Kadiyali | ... Convenor |
| M.C. Venkatesha | ... Member-Secretary |
| Members | |
| M.K. Bhalla | Prof. N. Ranganathan |
| S.S. Chakraborty | T.S. Reddy |
| V.D. Chhatre | Dr. A.C. Sarna |
| S.K. Ganguli | R.P. Sikka |
| Dr. A.K. Gupta | Dr. M.S. Srinivasan |
| D.P. Gupta | Dr. N.S. Srinivasan |
| T.T. Kesavan | The Director, Central Institute of Road |
| S. Kesavan Nair | Transport, Pune |
| Dr. S.P. Palaniswamy | M. Sampangi |
| Dr. S. Raghava Chari | |
| Ex-Officio | |
| The President, IRC (L.B. Chhetri) | |
| The Director General (Road Development), MOST | |
| The Secretary, IRC (Ninan Koshi) | |
| Corresponding Members | |
| Pradeep Jauhar | R. Ramakrishnan |
| S.G. Shah | Chittranjan Das |
| J.M. Vakil1 | |
The document was thereafter considered by the Highways Specifications & Standards Committee in its meeting held on 08.11.93 and approved subject to further modifications, if any, to be made by a subcommittee consisting of S/Shri M.K. Bhalla & A.P. Bahadur. The approval from Executive Committee was obtained through circulation. The document was subsequently considered by the Council in its meeting held on 20.11.93 at Bangalore, wherein Convenor & Member-Secretary of Highways Specifications & Standards Committee were authorised to carry out editing and minor modifications, if required, on the basis of comments of members before getting the same printed. The edited document was finally received from Convenor, Highways Specifications & Standards Committee on 8th March, 1995 for printing.
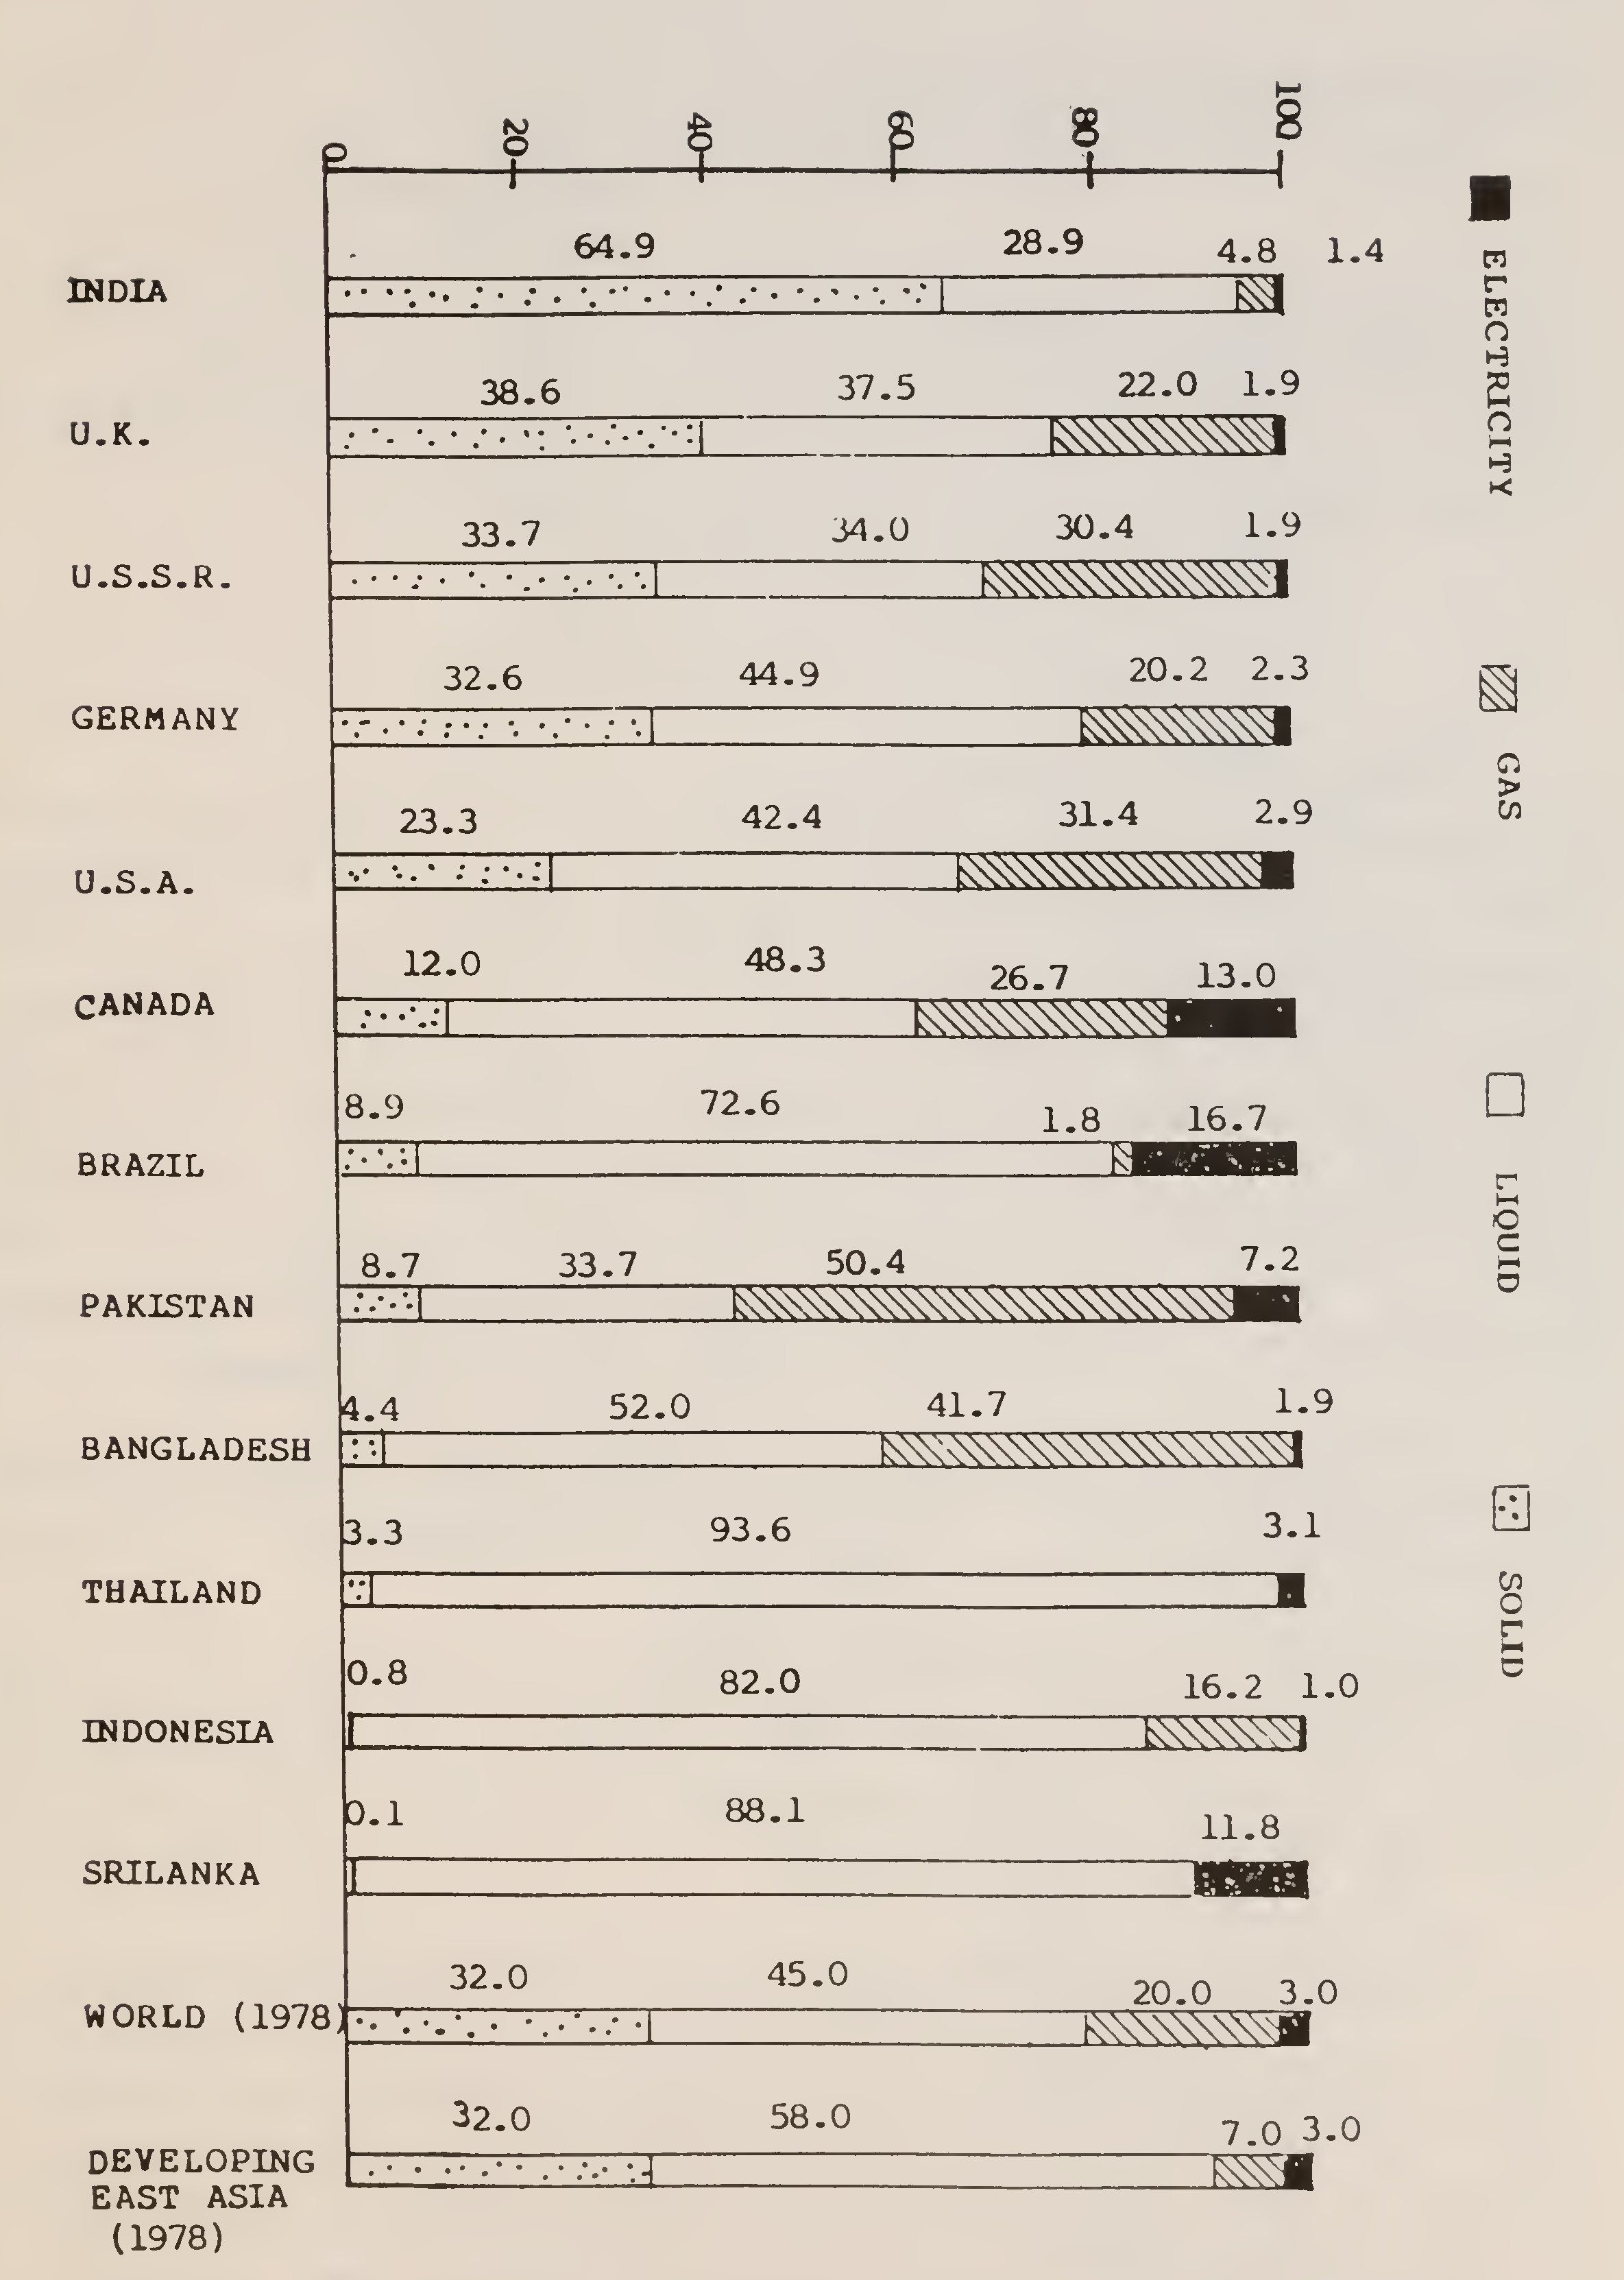
The energy transition from the traditional sources to the modern has taken place over the period of Industrial Revolution and the period following it. In the first phase, coal replaced wood as the dominant source of energy. In the second phase of transition, coal began to be replaced by oil, natural gas and electricity. At present, 45 per cent of the total energy consumed in the world is from liquid fuels, 32 per cent from solid fuels, 20 per cent from gas and the balance 3 per cent from electricity. Oil is thus the predominant source of energy in the world.
The share of these four principal forms of energy in some selected countries make interesting reading, Fig. 1. In India, the major share (65 per cent) is for solid fuels because of the dependence of coal and firewood. Next in importance comes liquid fuels, which account for nearly 29 per cent. The shares of gas and electricity are 5 and 1 per cent respectively. As a contrast, the U.S.A., one of the most industralised nations, obtains the bulk (42 per cent) of its energy requirements through liquid fuels. Solids account for only 23 per cent, whereas gas accounts for 31 per cent and electricity accounts for 3 per cent. As nations have marched ahead in industrial activity, they have switched on progressively to liquid fuels and gas.
Fossil fuels (oil, gas and coal) are not inexhaustible. The proven original2
Fig. 1. Share of various types of energy consumption in selected countries3
endowment of these are as under :
| (Billion barrels of oil equivalent) |
||
| Conventional (light and medium) oil | : | 1635 |
| Gas (in terms of equivalent oil) | : | 1897 |
| Heavy oils | : | 608 |
| Bitumen deposits | : | 354 |
| Oil shale deposits | : | 1066 |
| Total | : | 5560 |
| Coal | : | 7600 billion tonnes |
These are being consumed at a very fast rate. Nearly 30 per cent of the conventional oil, 14 per cent of gas and 11 per cent of heavy oils have already been consumed. Everyday 53 million barrels of oil are produced and consumed. Thus at the current level of consumption, liquid fuels may not last for more than 3 or 4 decades. It may be mentioned that the first 200 billion barrels of world oil were produced in 109 years from 1859 to 1968. The second 200 billion barrels were produced in just 10 years from 1968 to 1978. The third 200 billion barrels would have been consumed in the period 1978 to 1988. The world production rates seem to have stabilised at around 20 billion barrels a year, thanks to energy conservation measures.
Coal deposits can, however, last for a much longer time. At present only about 2.5 per cent of the reserves has been exploited. Thus world coal deposits can last to more than 3,000 years.
The price of oil is very sensitive to political developments. The energy shocks of 1974 and 1979-80 have been accompanied by steep increase in the price. The recent Gulf war saw the price of a barrel to touch $42. Fig. 2 shows the trend in OPEC oil prices.
The developing countries, many of which are non-oil-producing, are bound to be hit very adversely by the growing price of oil. Already the per capita consumption of energy is very low in these countries, and they have a long march ahead to catch up (Fig. 3). Whereas the growth rate of energy consumption in the developed economies during 1980-89 was in the range of 1-2 per cent per annum, in the developing countries it was in the range of 3-6 per cent. In India’s case, it was 6.1 per cent. The GNP grew at around 5 per cent during this period. Thus, the growth rate of energy consumption4
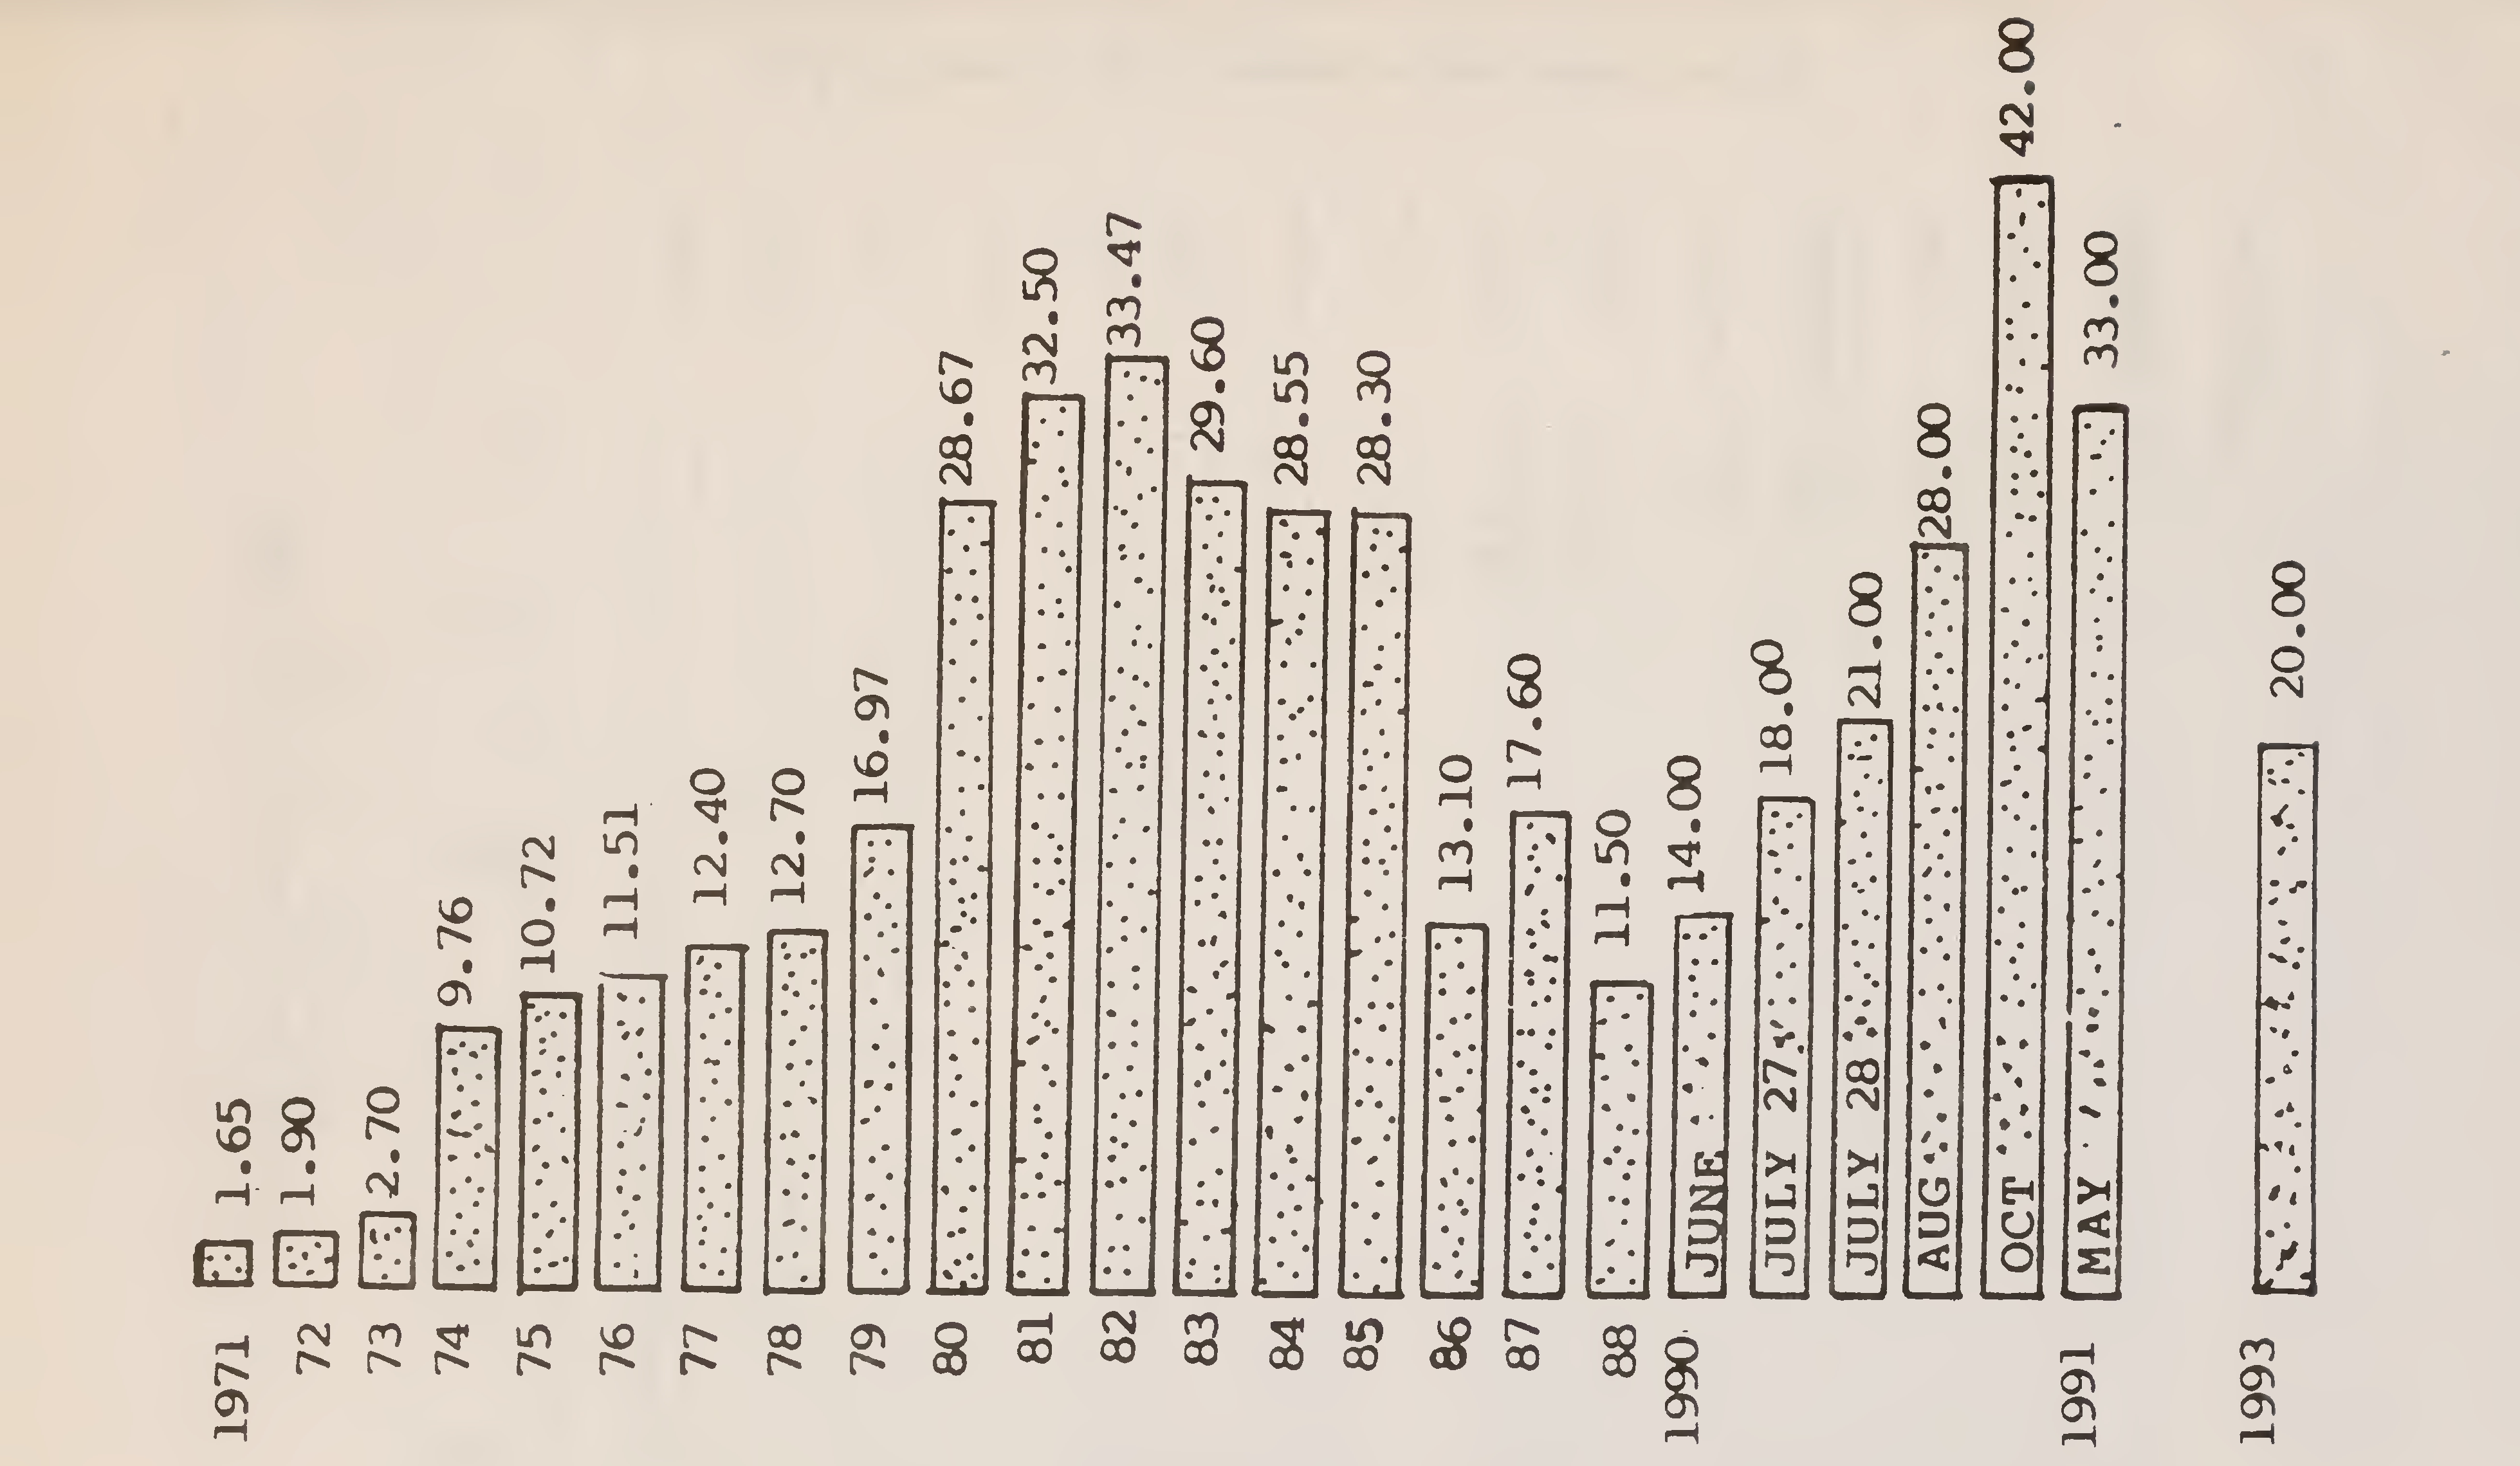
Fig. 2. OPEC oil price (in US dollar)5
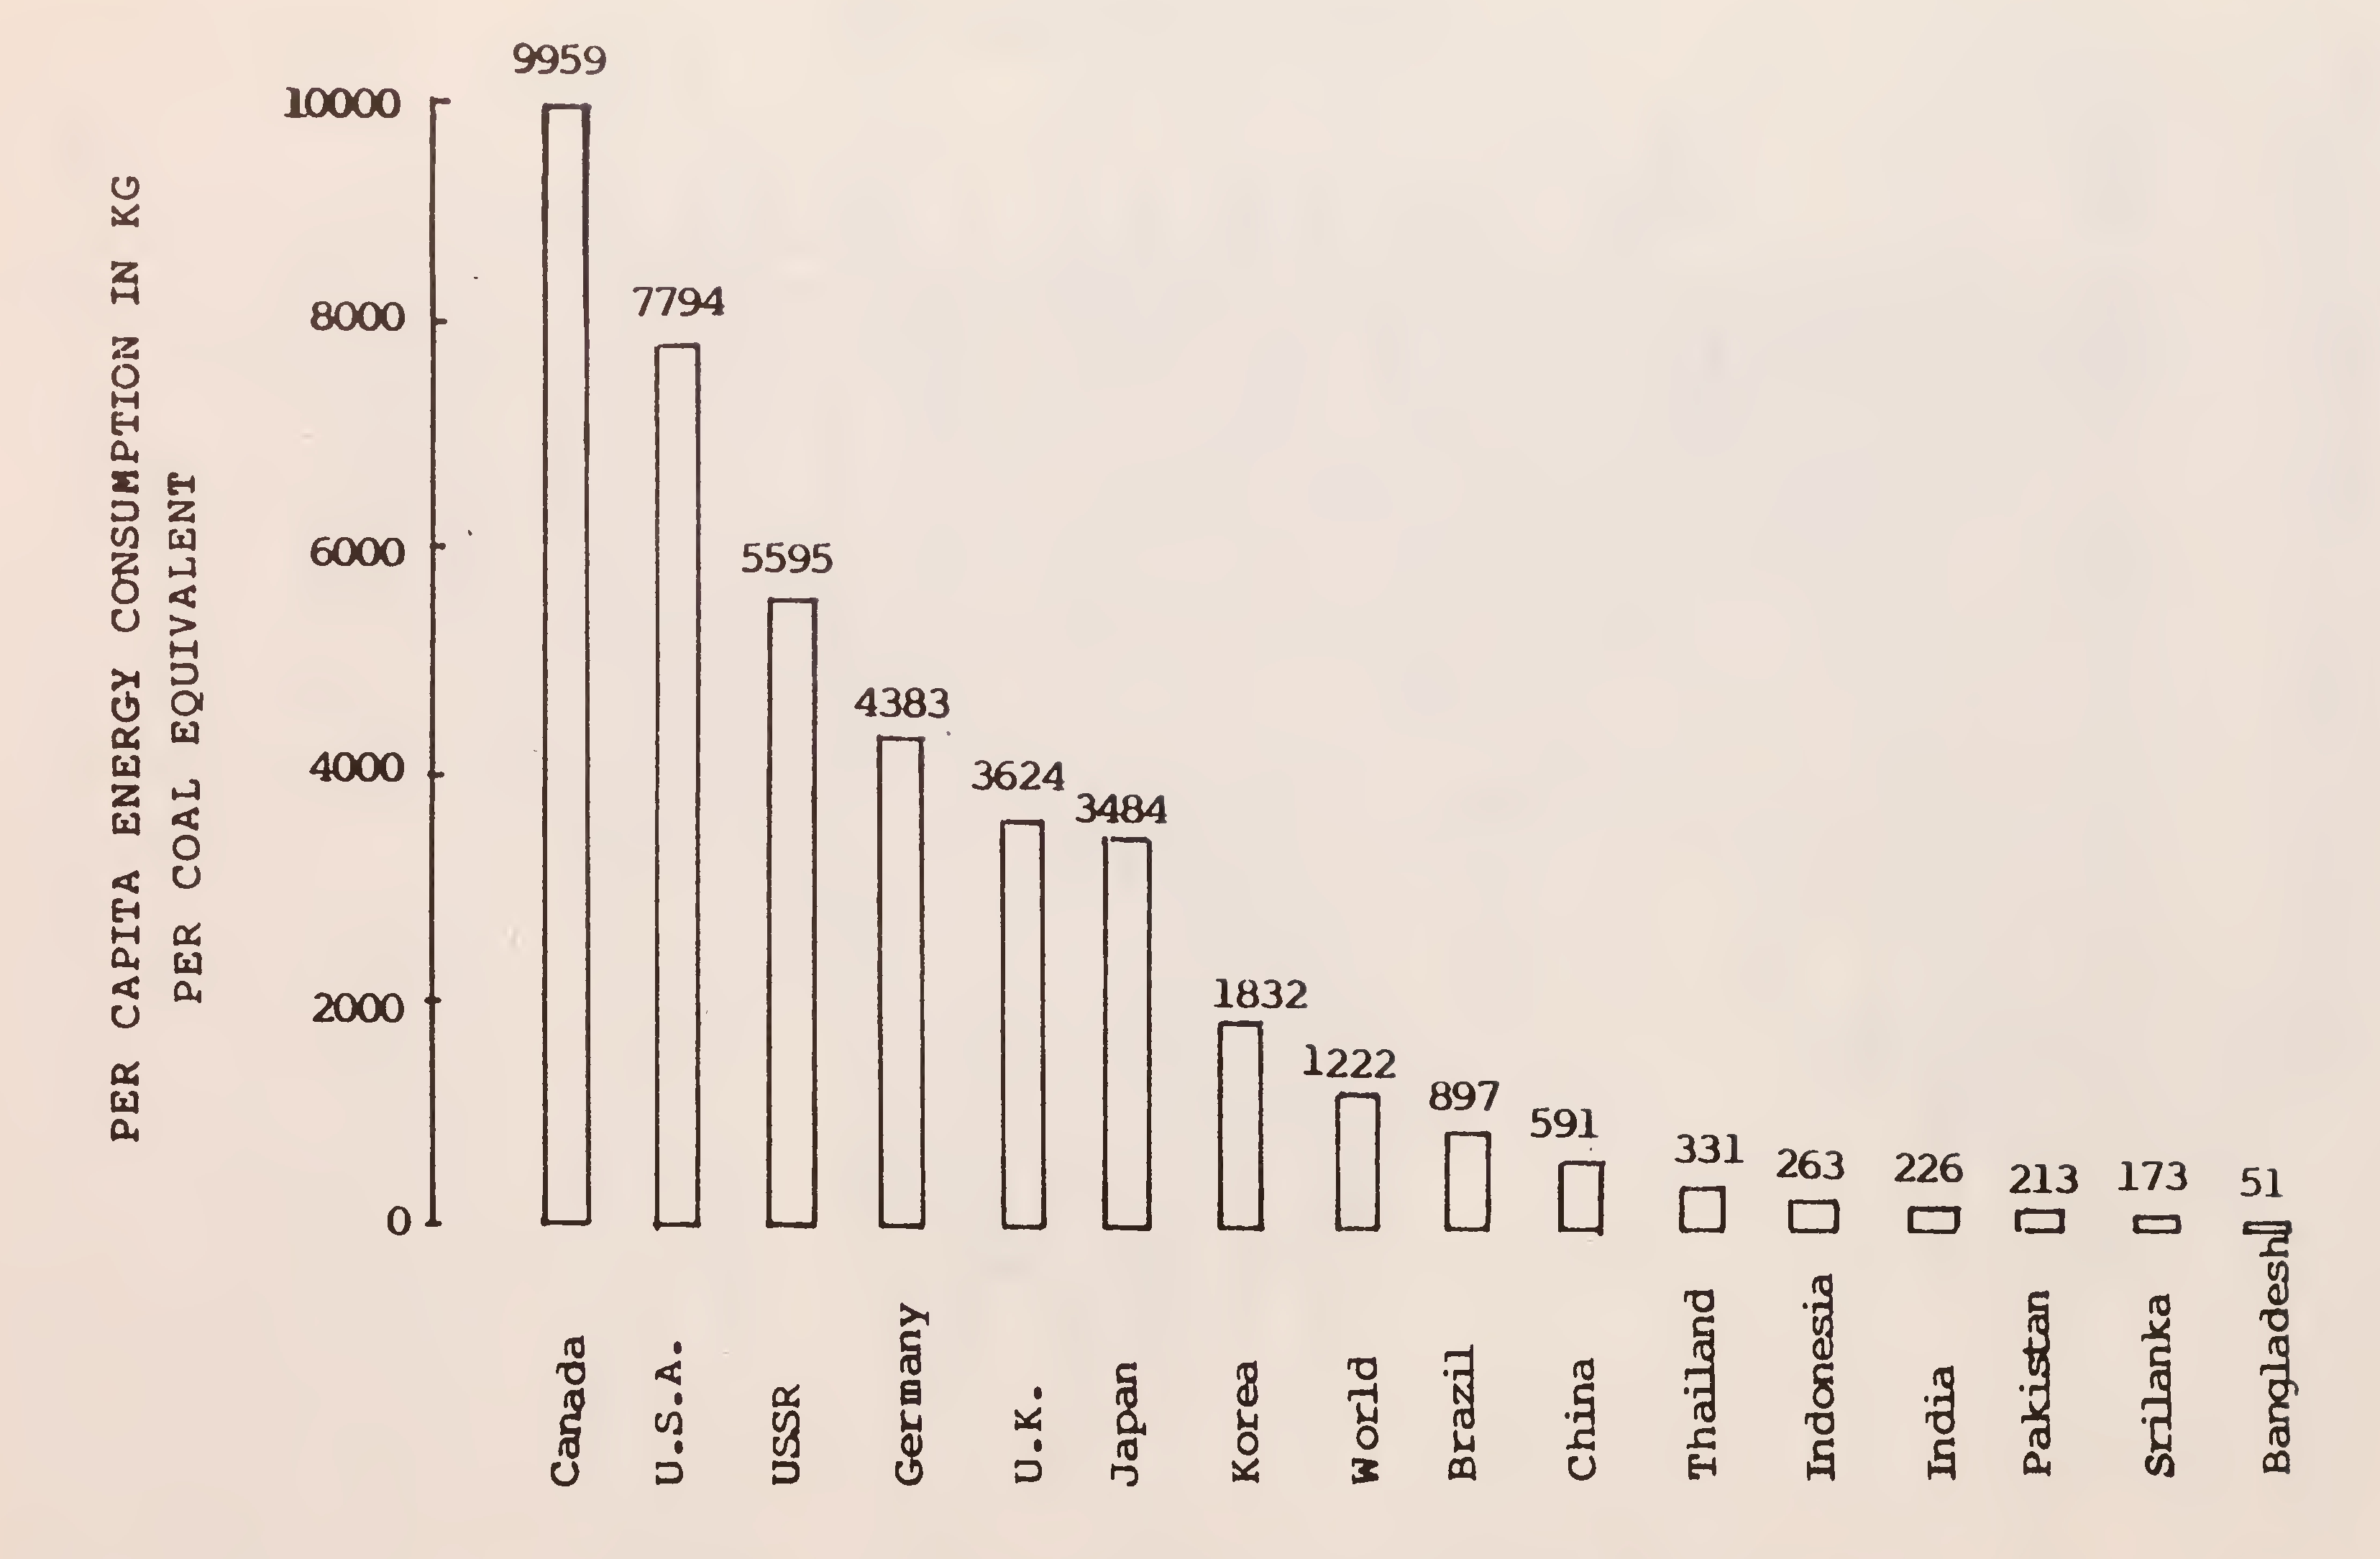
Fig. 3. Per capita energy consumption in some selected countries6
is slightly more than that of GNP. This trend is likely to continue. India and other developing countries will have to investigate ways and means of conserving energy.
The coal reserves in India are estimated to be 83,000 million tonnes. The present rate of consumption is 200 million tonnes. At this rate, the reserves can last for another three to four centuries. Out of an estimated hydro-electric potential of 396 TWH (Trillion Watt-Hour), the electricity generated is around 50 TWH. Thus there is a good scope for development of hydro-electric reserves in India. India’s published and proved oil reserves are 4.3 billion barrels (roughly 300 million tonnes). It may take just 17 years to exhaust these. India has some gas reserves, which are now being tapped.
Since oil reserves in India are fast depleting, the long-term strategy for energy should be to tap its hydro-electric potential, build nuclear power plants and tap renewable energy sources (solar, wind, geothermal, wave, biomass, etc.)
India has had a remarkable success story in oil exploration and production. Beginning with a meagre 0.2 million tonne is 1950, the production rate now is 30 million tonnes (1991-92). In view of the encouraging results of recent exploration activities, it is likely that the programme of oil exploration and development will be accelerated in the coming years.
The production and consumption of crude oil in the last decade are indicated in Figs. 4 and 5 respectively. The consumption of petroleum products is indicated in Fig. 6. The average annual rate of growth of consumption of petroleum products during the period 1974 to 1991 has been 5.6 per cent. The excess of consumption over indigenous production has resulted in inevitable oil imports, Fig. 7. The mounting fuel import bill is depicted in Fig. 8. The deficit in oil, which was nearly 60 per cent in 198081, was around 30 per cent in 1989-90. In 1980-90, the oil imports consumed nearly 22 per cent of the export earnings. These statistics demonstrate that India is under severe economic pressure on account of the mounting oil consumption.
The consumption of oil products in the country has grown at a7
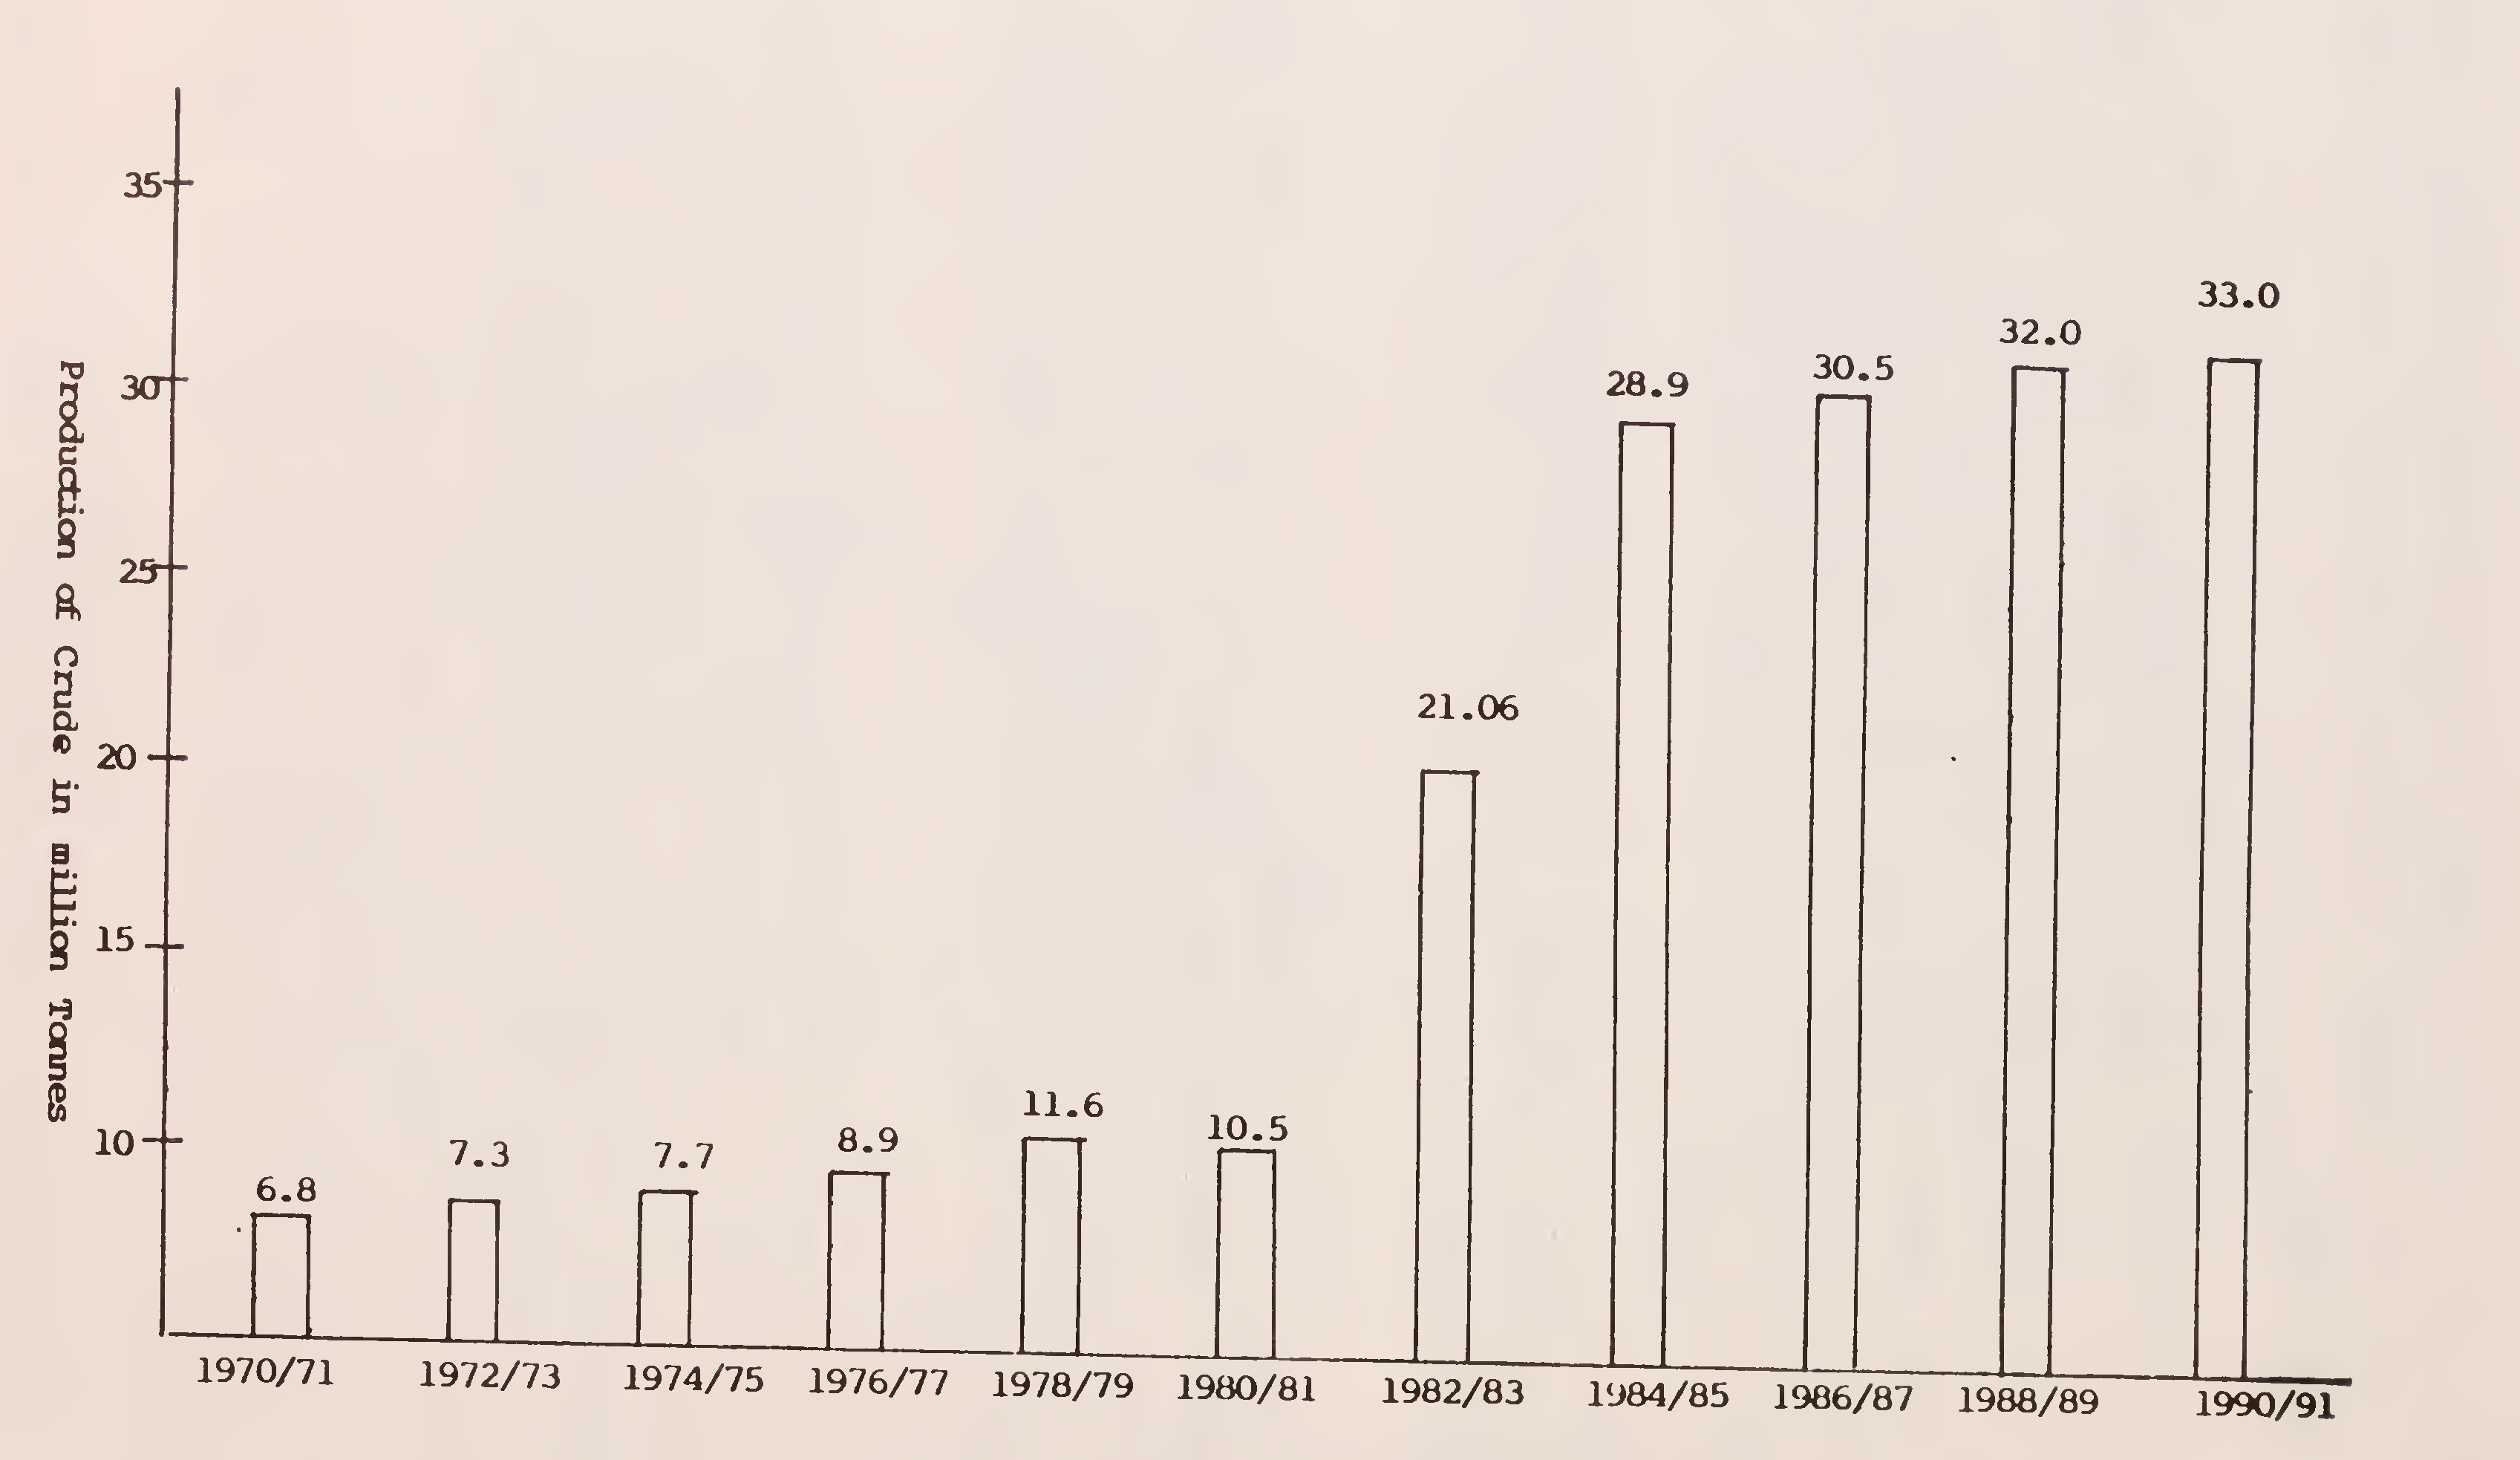
Fig. 4. Production of crude oil8
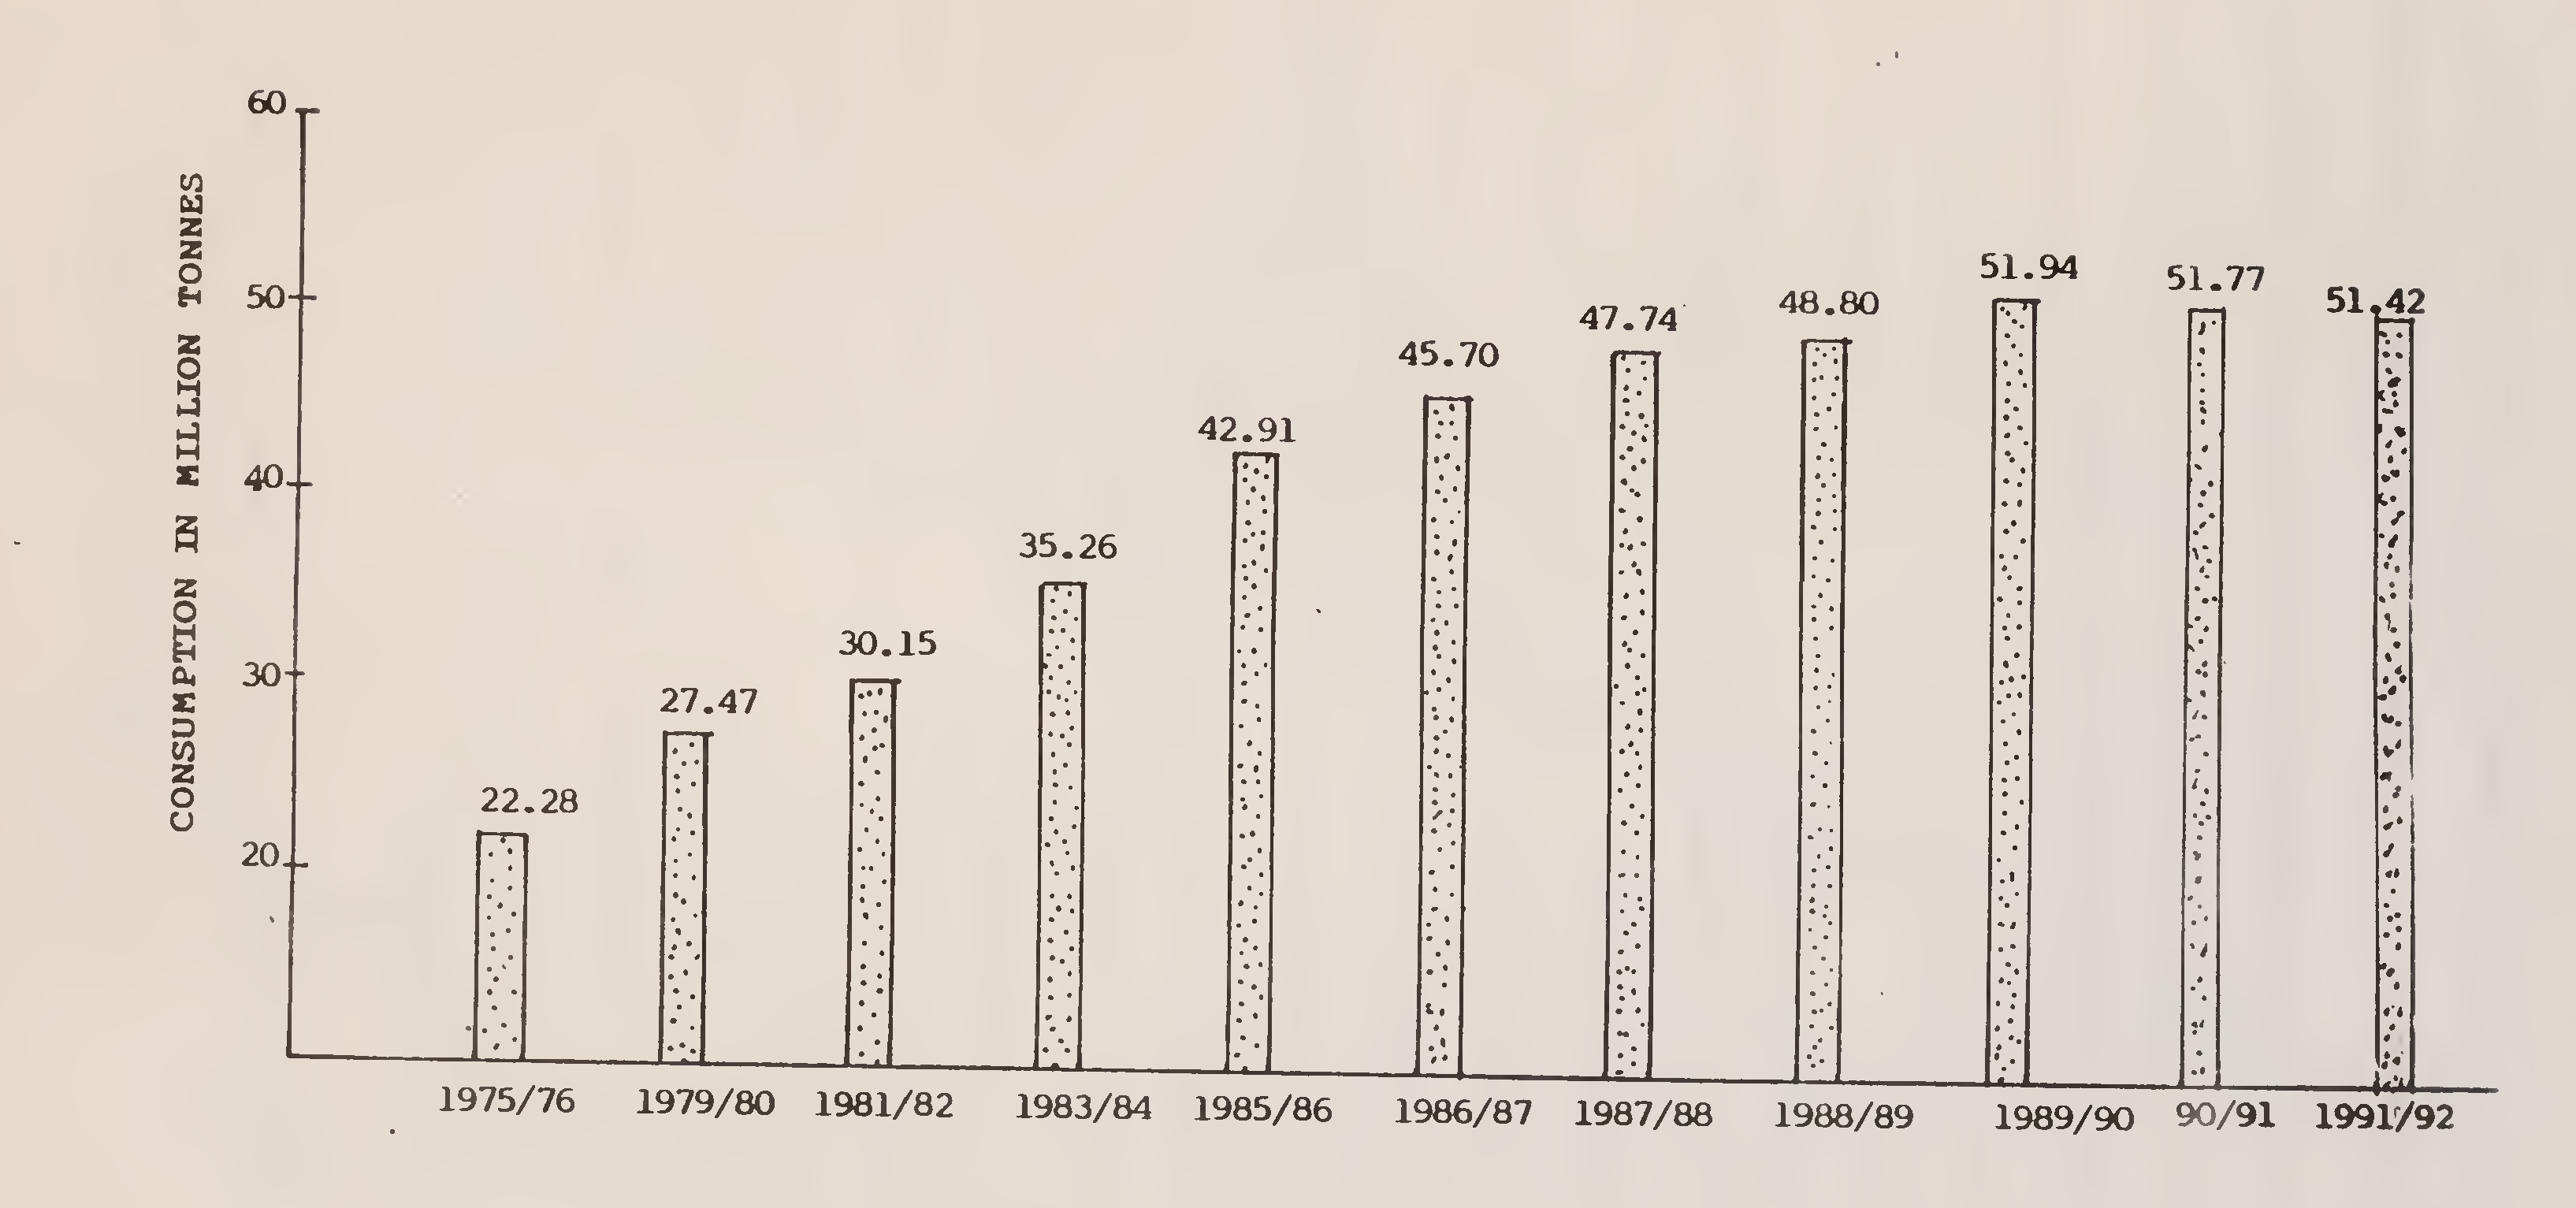
Fig. 5. Consumption of erude oil in India9
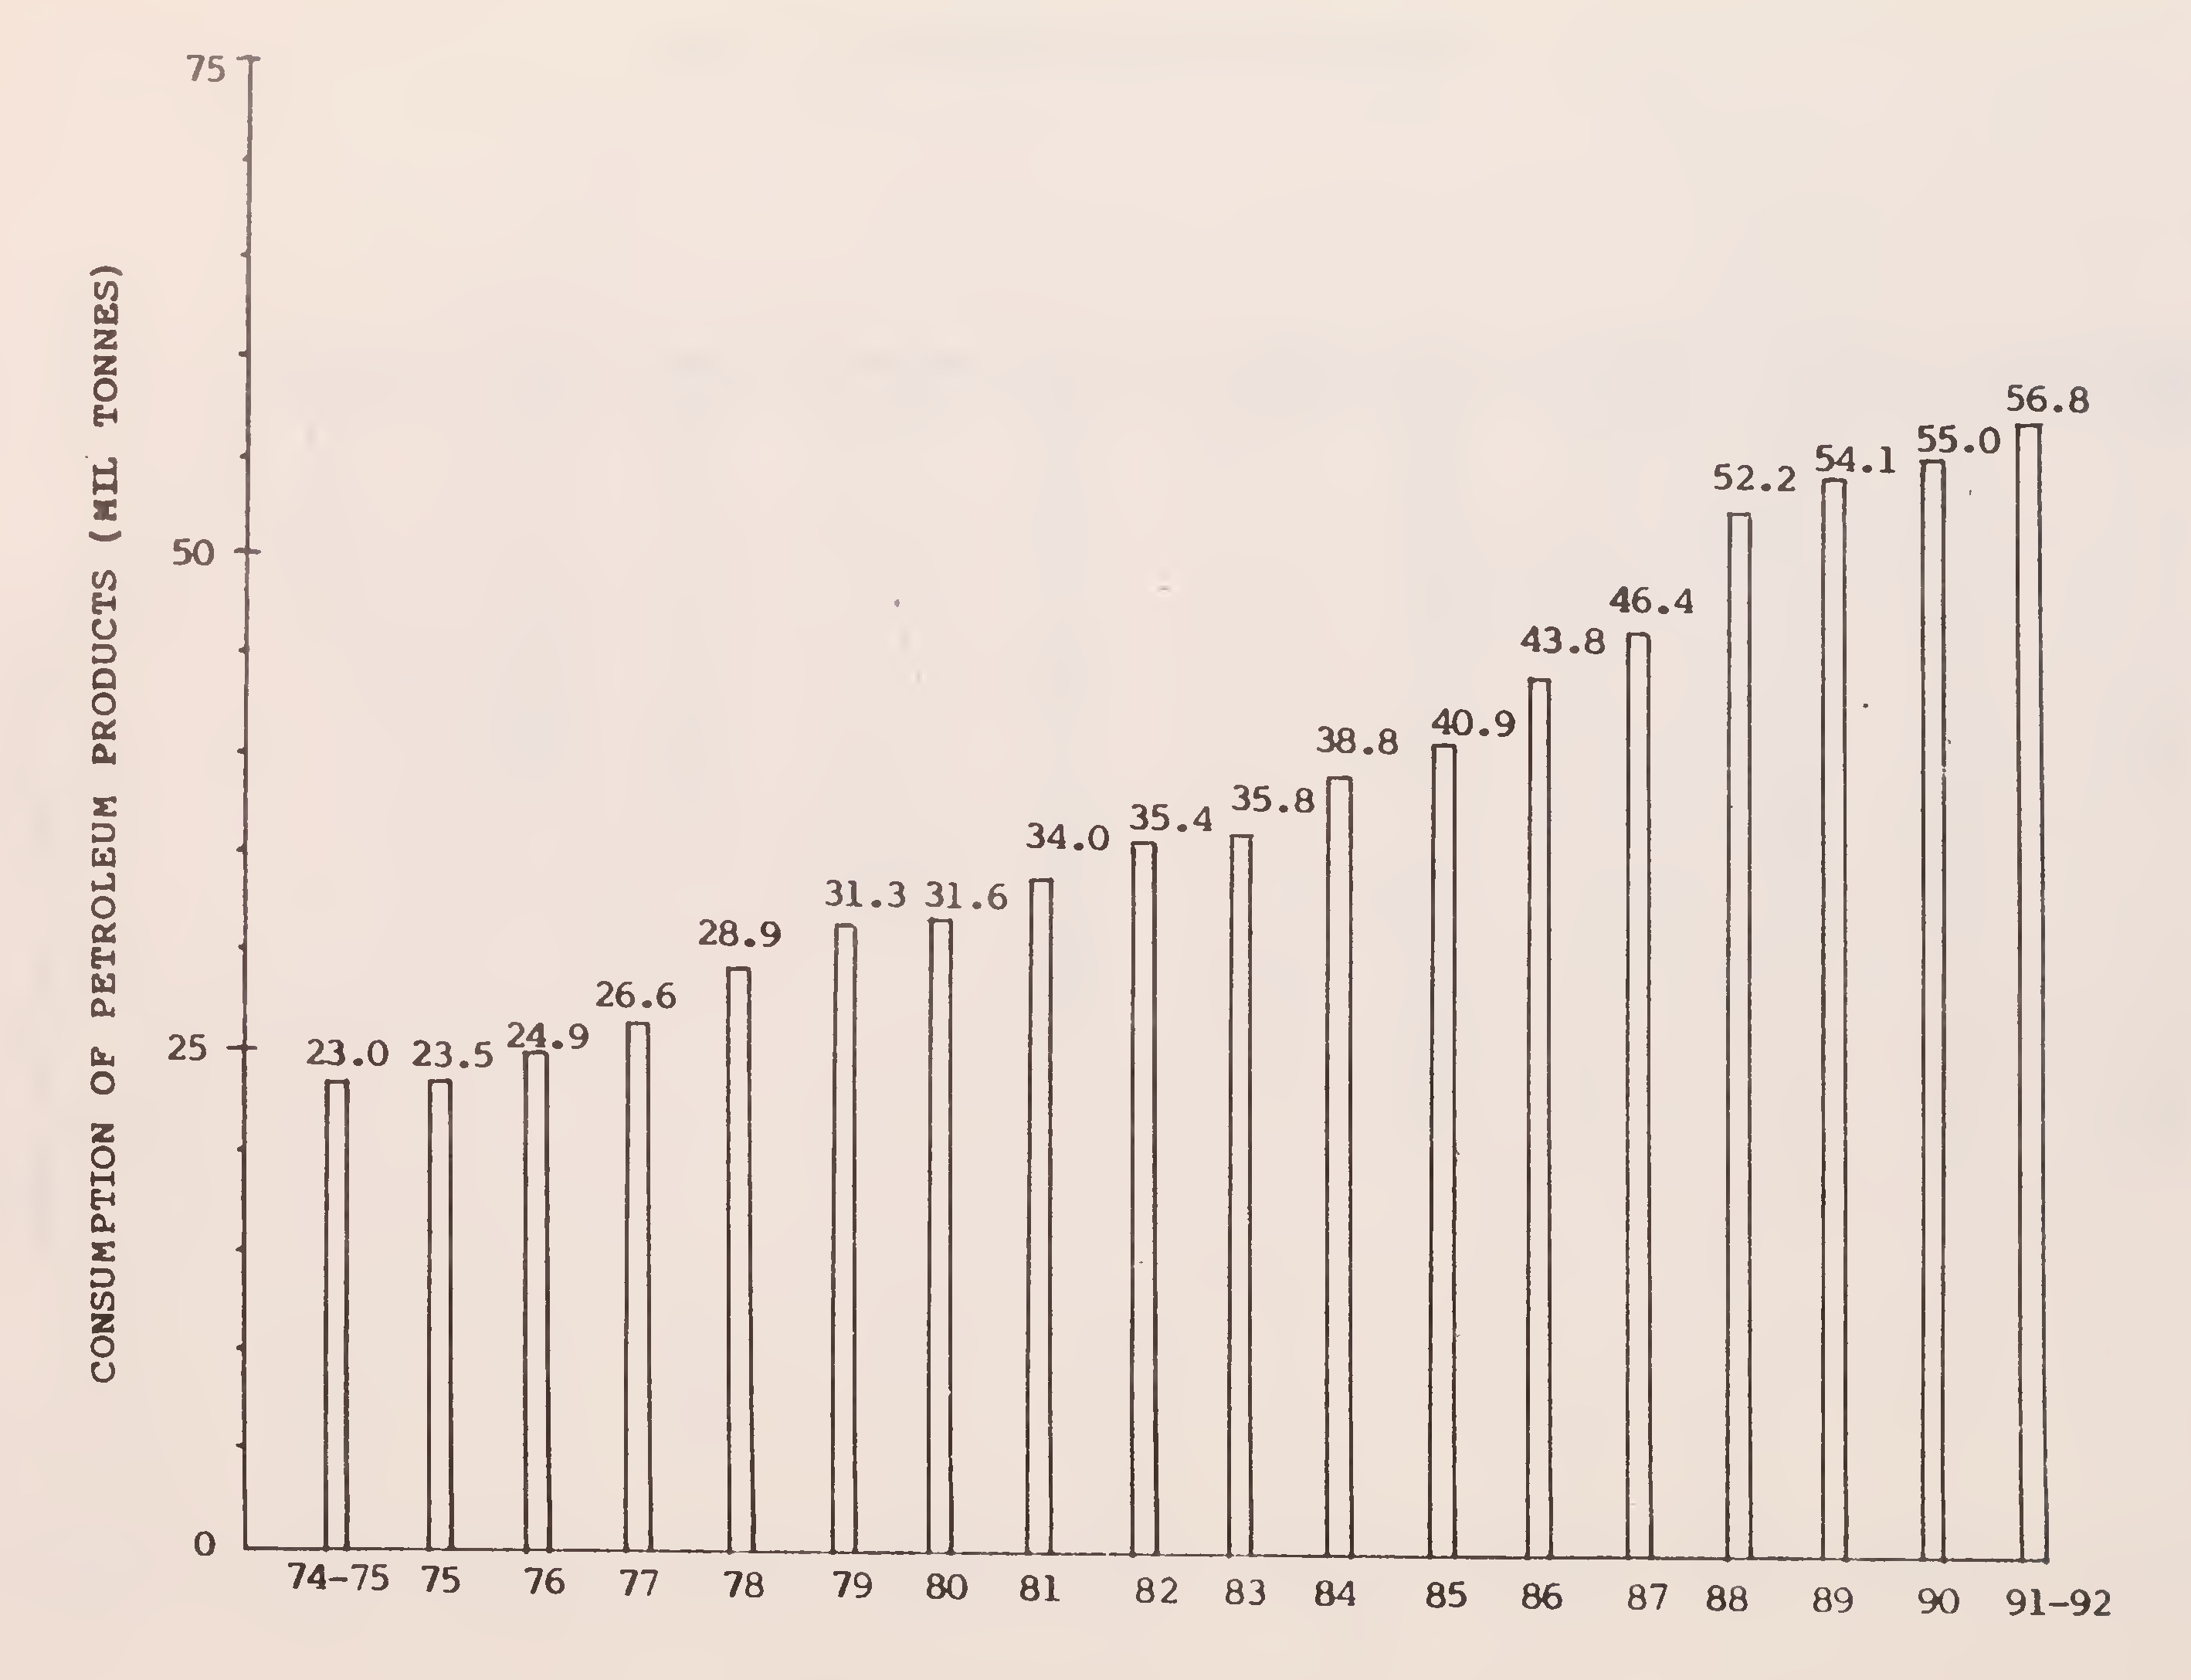
Fig. 6. Consumption of petroleum products10
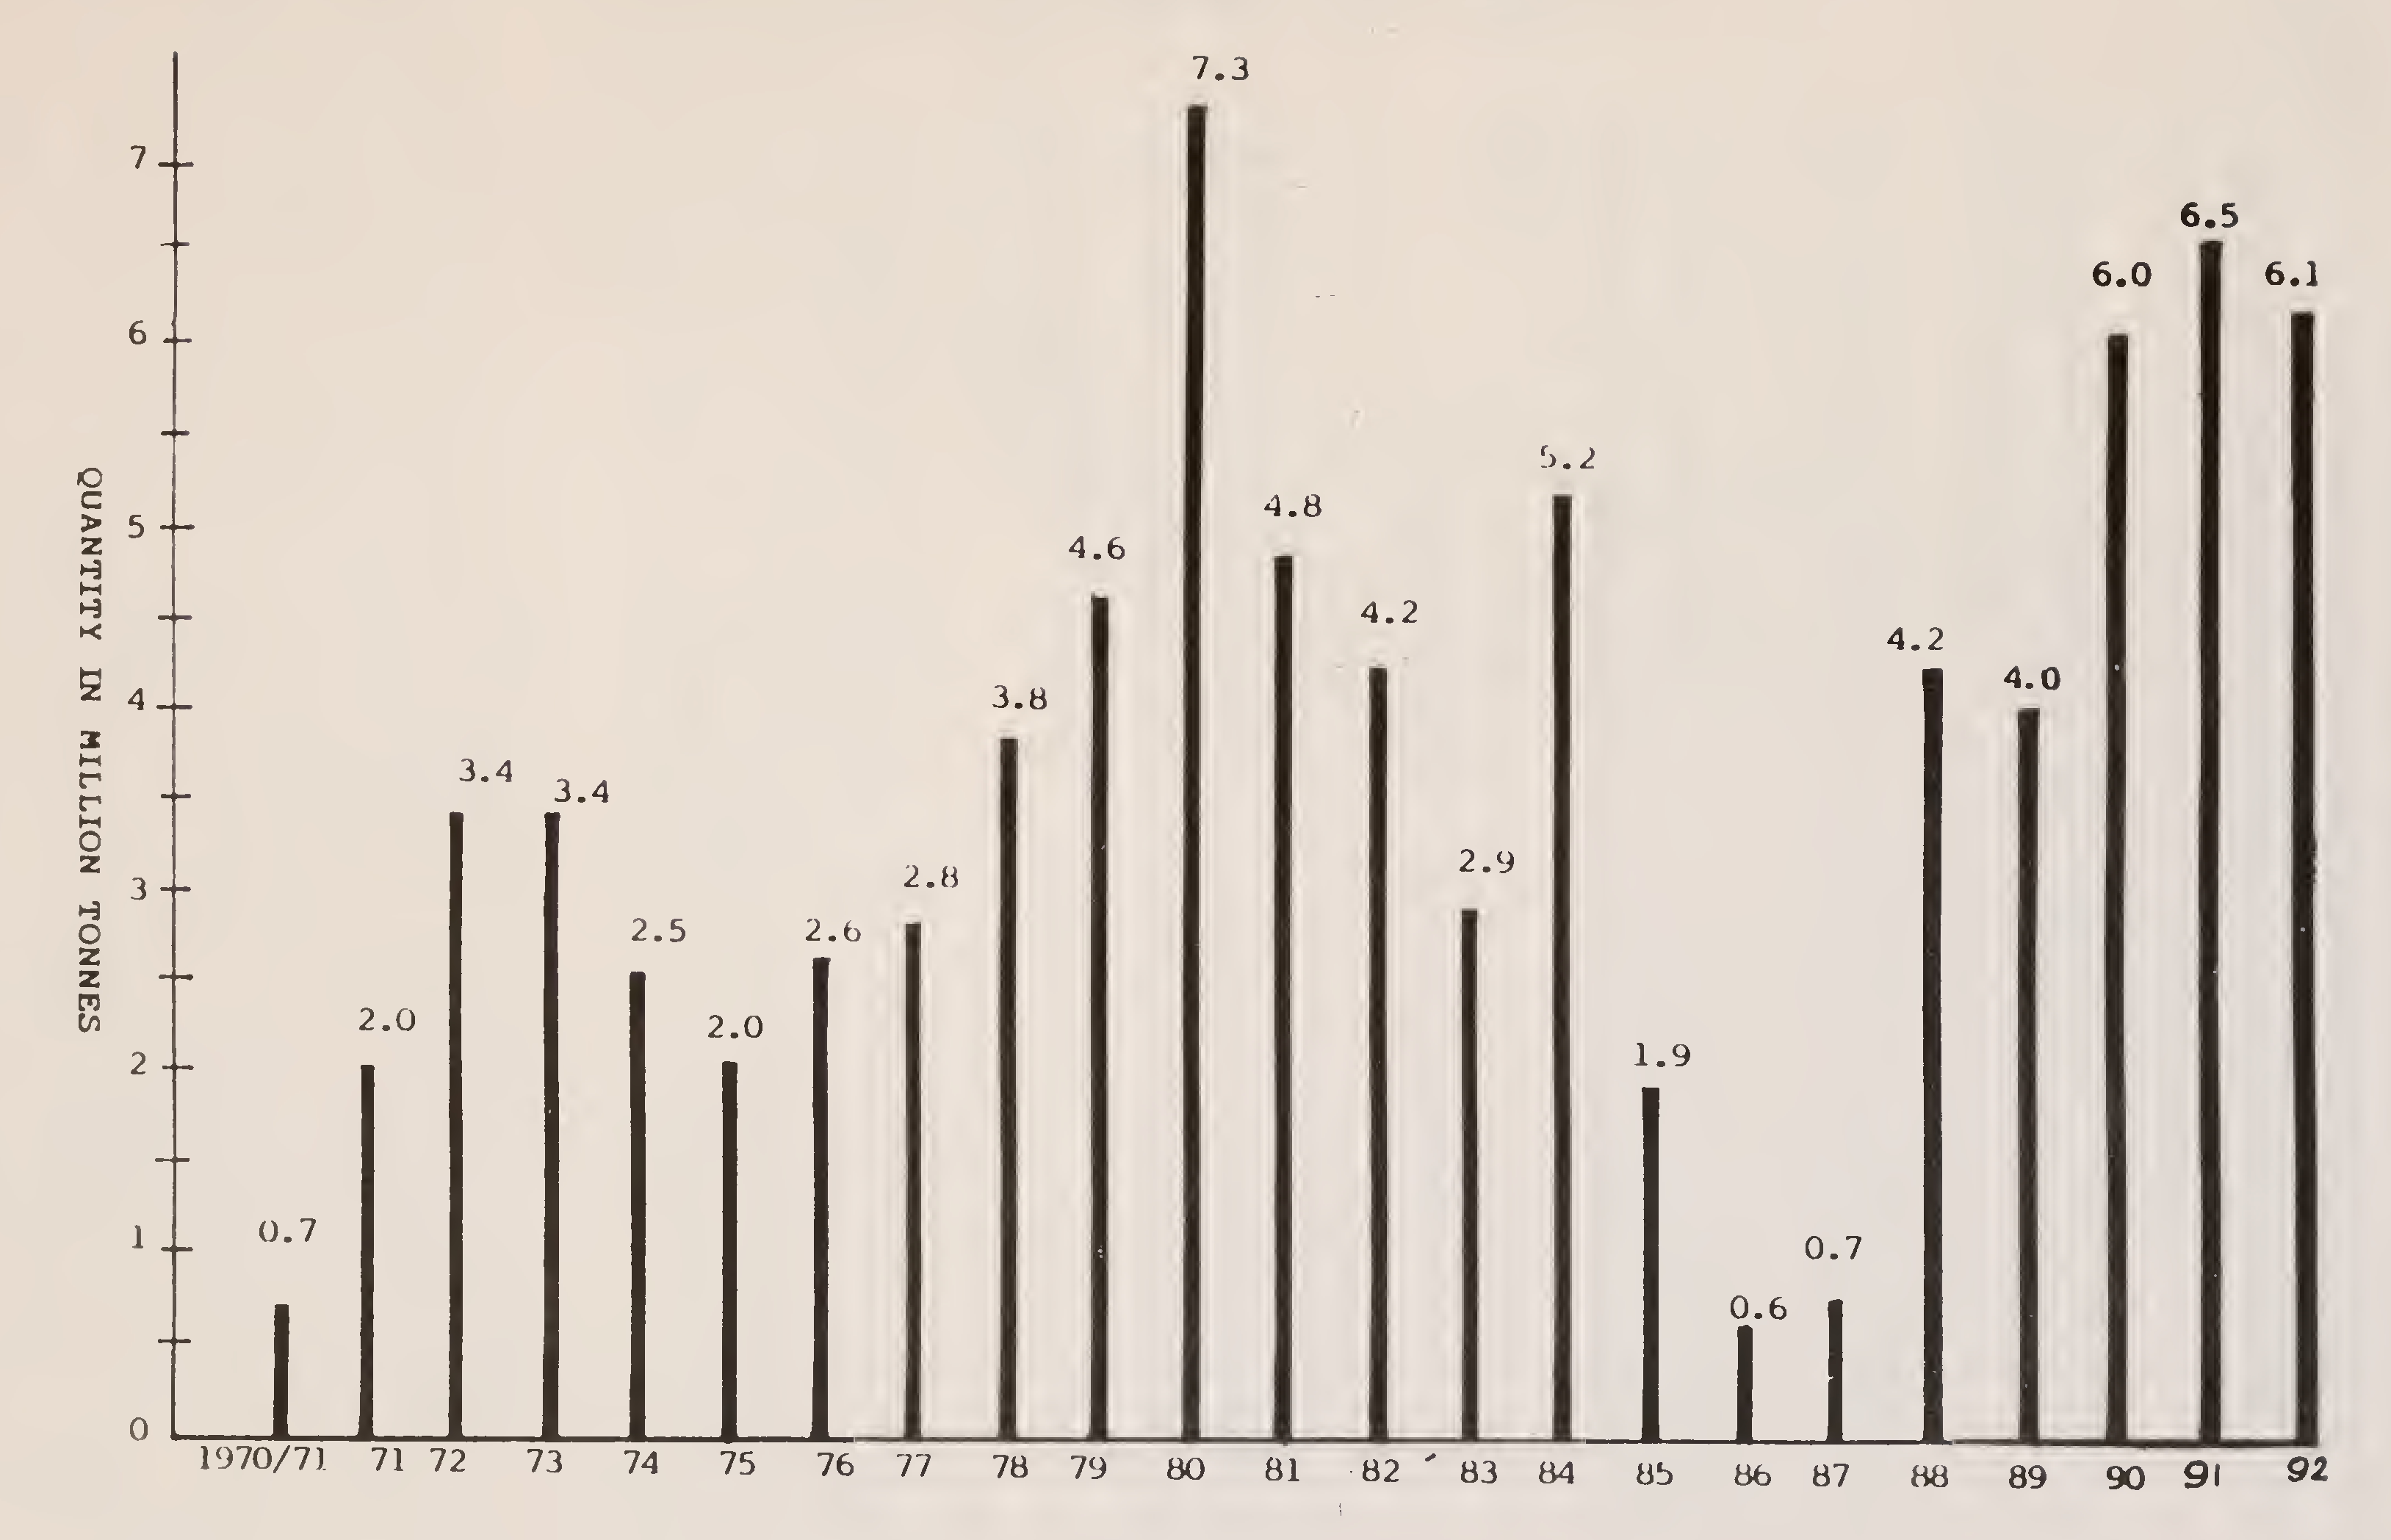
Fig. 7. Net imports of petroleum products11
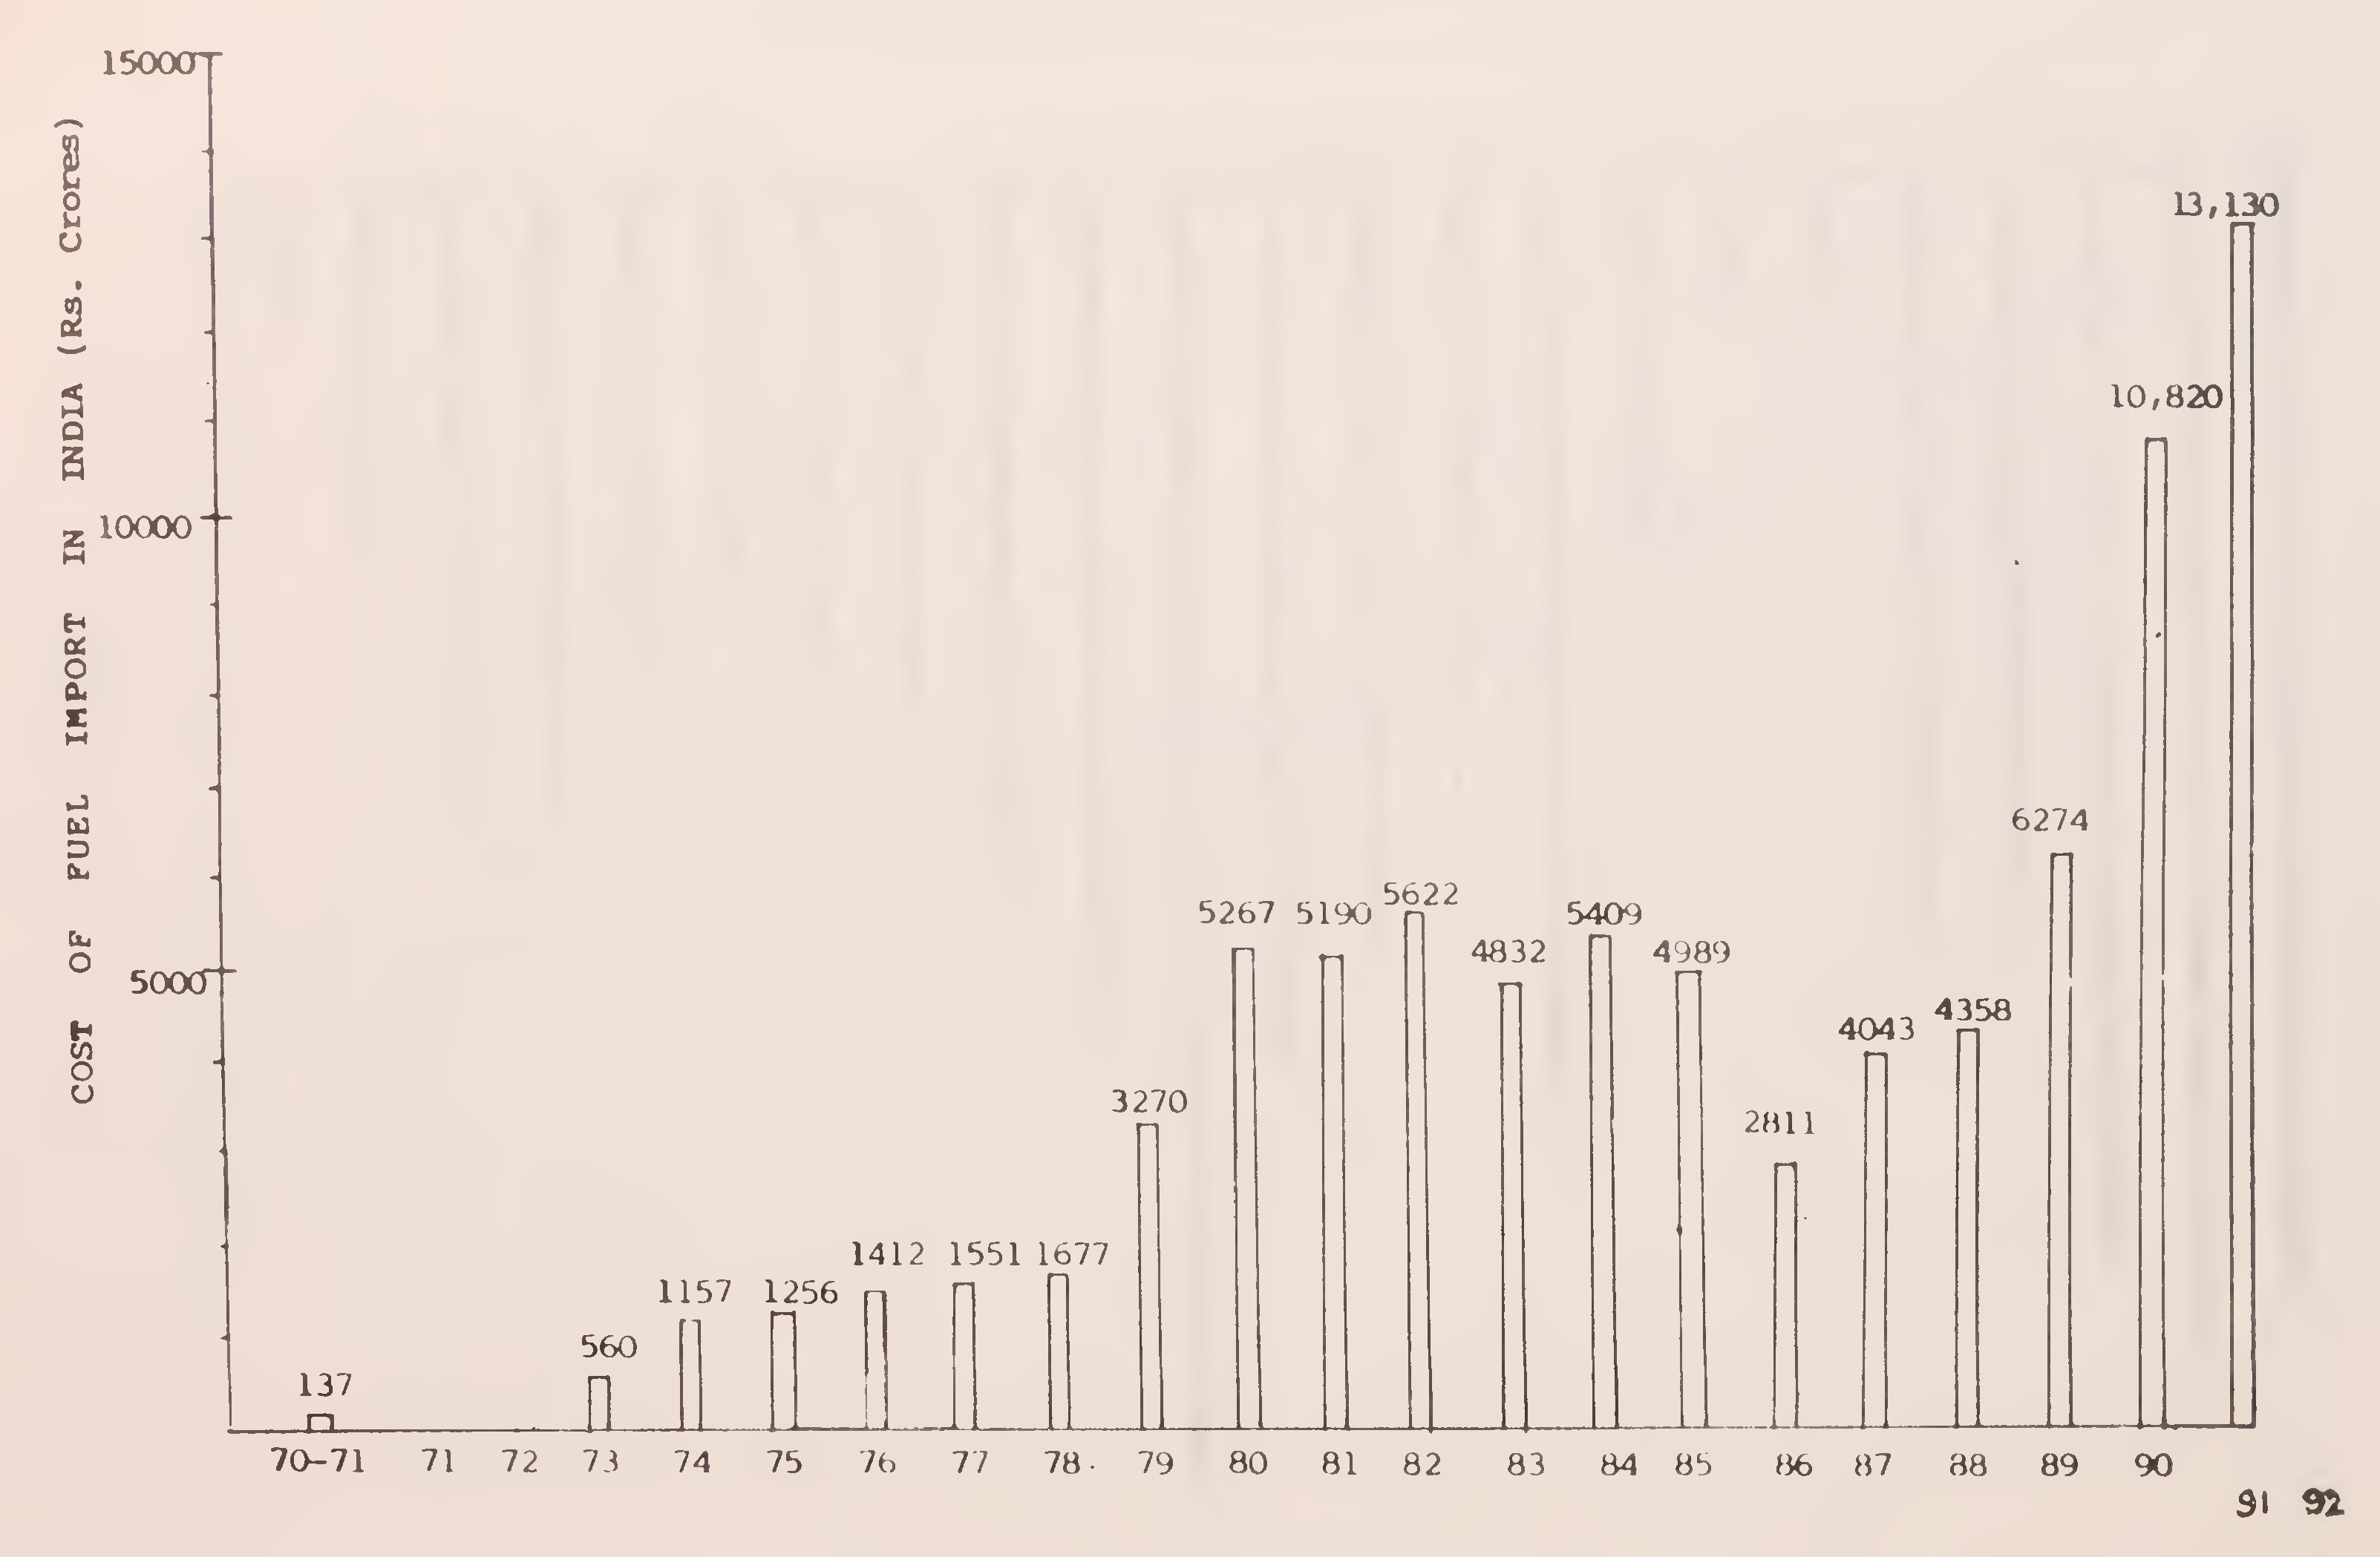
Fig. 8. The mounting fuel hill in India12
compound rate of 5.6 per cent per annum in the period 1974-90. During the Sixth Plan the growth rate was 5.5 per cent. In the Seventh Plan, the growth rate was 6.8 per cent.
Fig. 9 gives the per capita consumption of petrol in some selected countries. The highest is in USA with 1,438 kg. In India, it is a low 3 kg.
Fig. 10 gives the per capita consumption of diesel in some selected countries. Australia leads with 431 kg. India’s consumption is 18 kg.
Both in terms of production and consumption of energy, India is at tail end. Inspite of this unhappy situation about 24 per cent of energy in India is lost before its final end use.
Transport is an important sector which consumes energy. The percentage share of the transport sector in total commercial energy consumption in some selected countries is shown in Fig. 11. In some countries, the share is as high as 56 per cent, whereas in some others it is as low as 11 per cent. In India is around 24 per cent.
The Railways use coal, oil and electricity for traction. The percentage share of oil has gone up progressively in the past years with a downward shift in the use of coal. The increasing stress on railway electrification currently being pursued will result in less dependence on oil and should be welcomed.
Road transport is totally dependent on oil for propulsion. Though alternative fuels are being investigated, in the immediate future petroleum products alone will be the propulsion fuel. The alternate fuels being considered are methanol, compressed natural gas, hydrogen and electricity (through batteries). But it will take many years of research to accomplish success in their common use in road vehicles. The other modes of transport, viz, air transport and ships, also use oil exclusively. Fig. 12 gives the model distribution of the commercial energy in India in the transport sector. It is seen that oil forms 84 per cent of the energy consumption in the transport sector. Oil for road transport alone accounts for 65 per cent of the total energy13
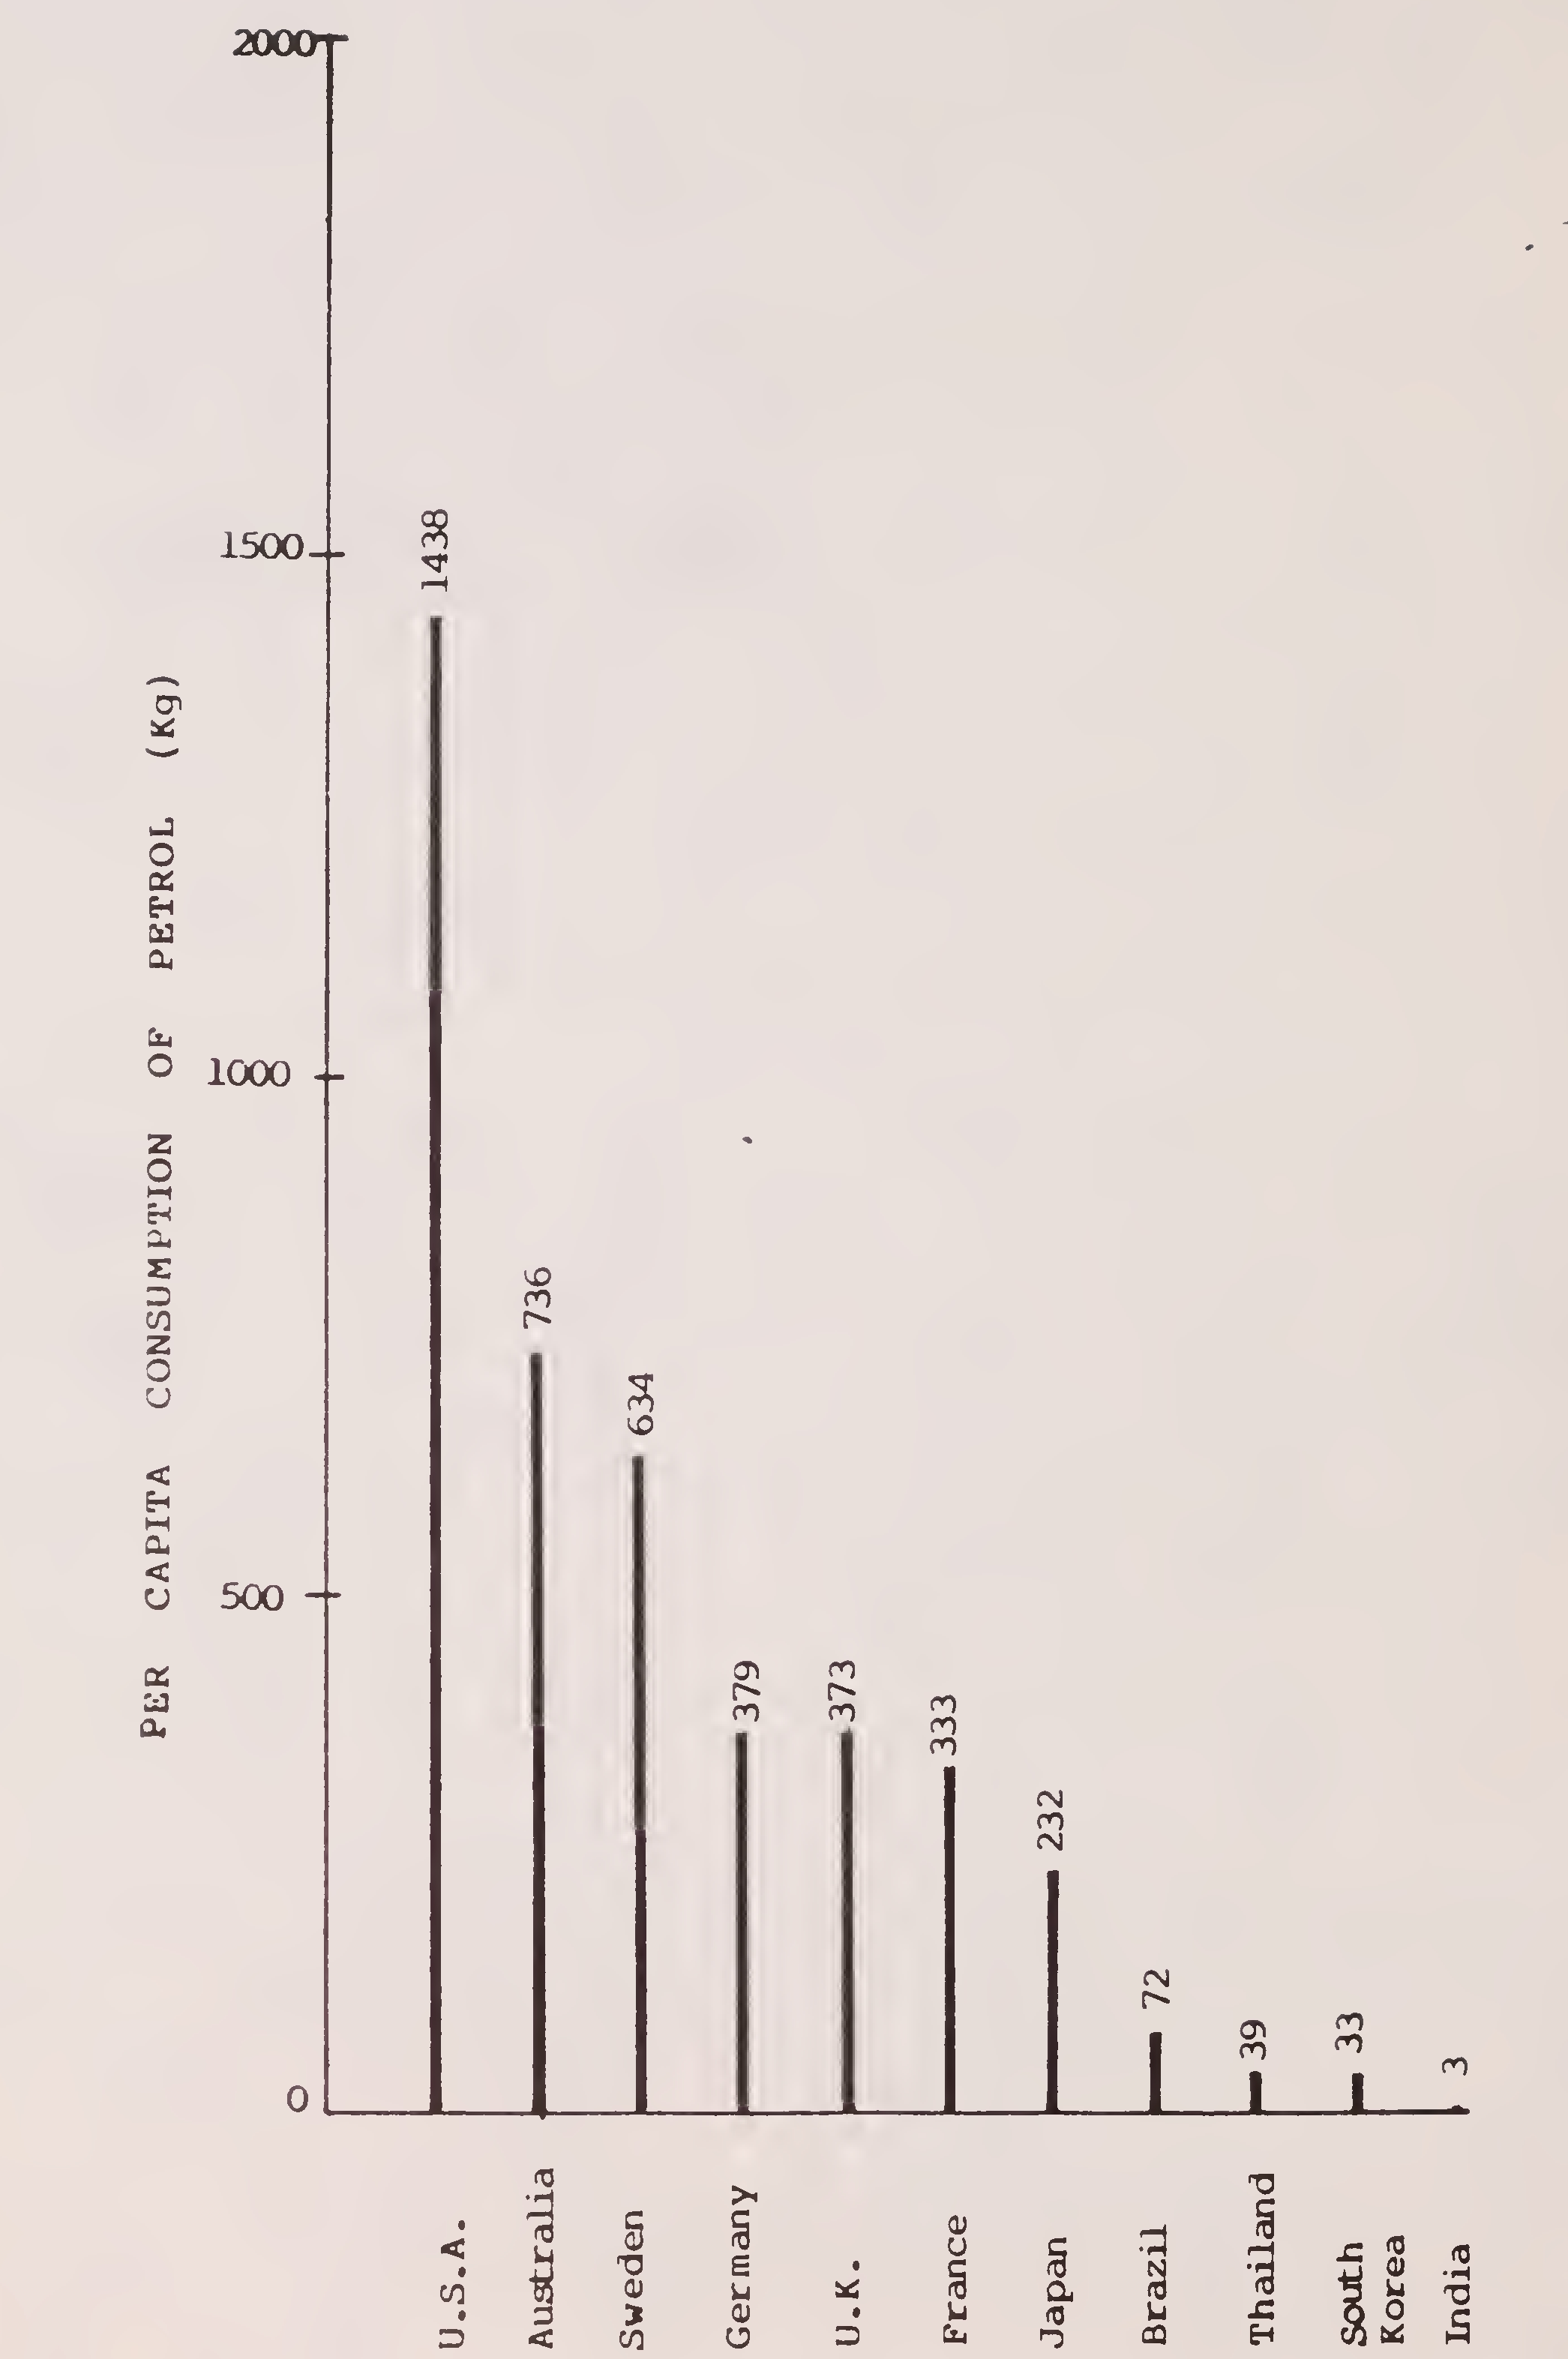
Fig. 9. Per capita consumption of petrol in some selected countries14
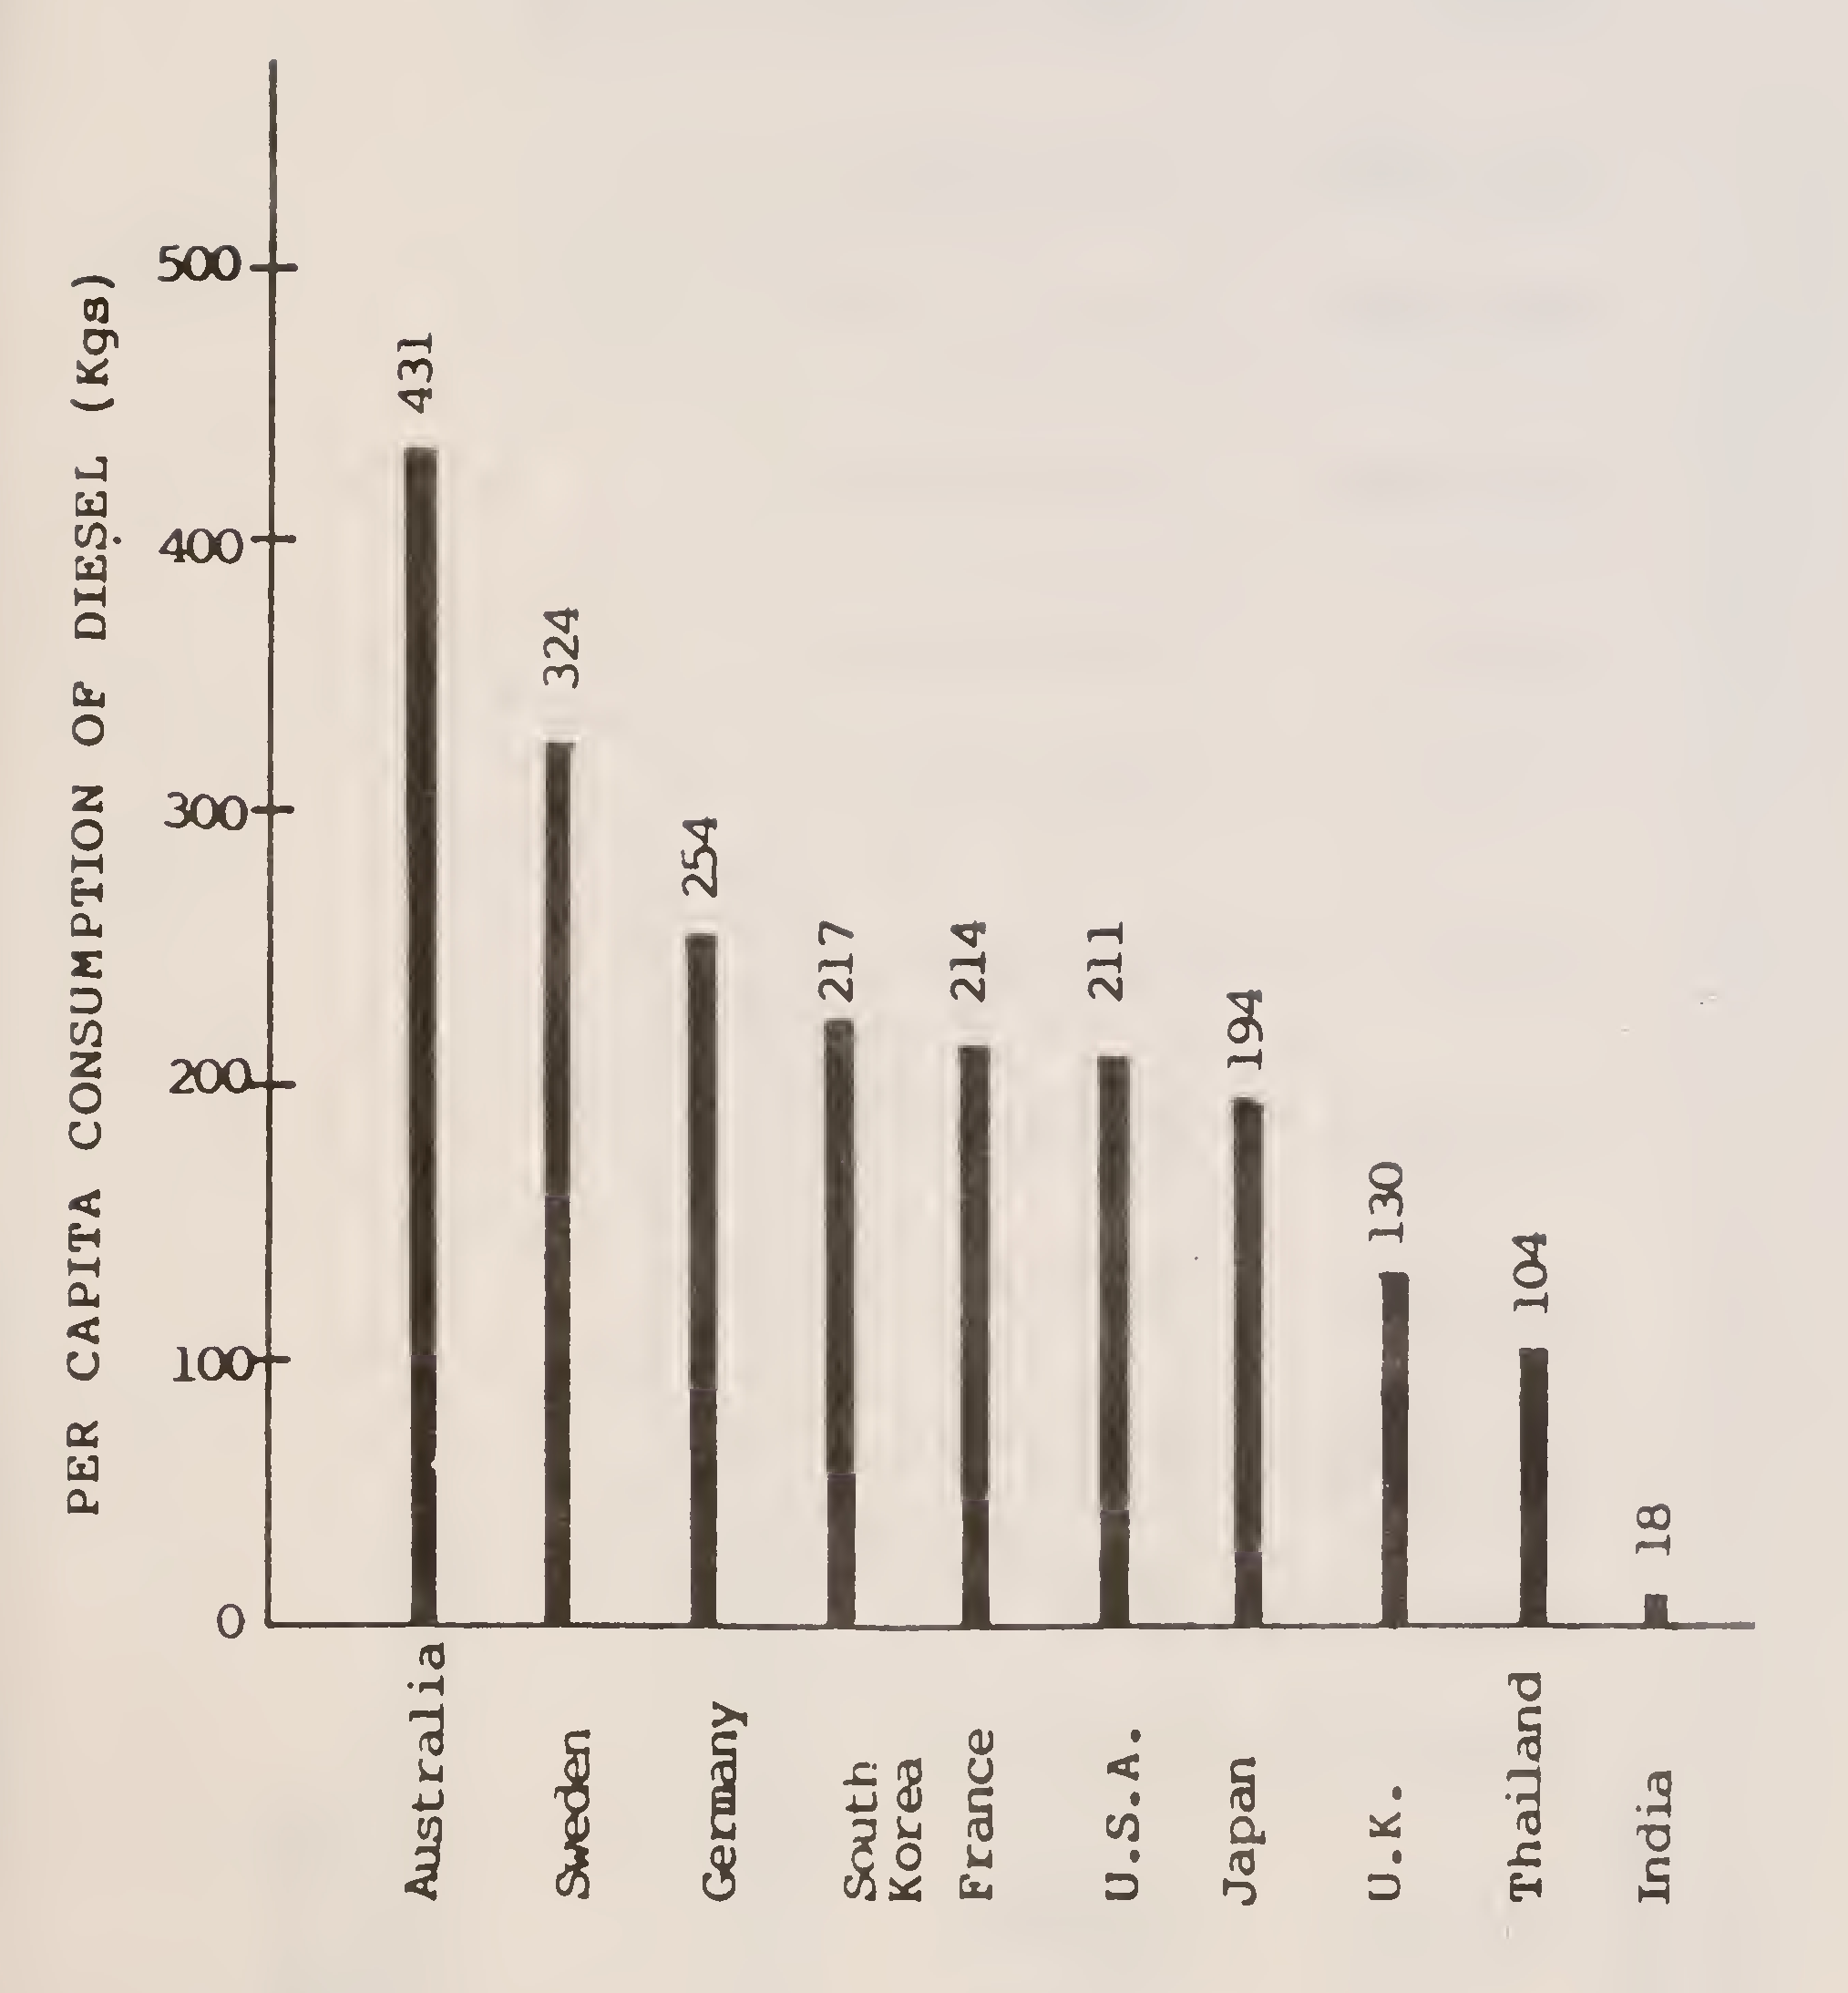
Fig. 10. Per capita consumption of diesel in selected countries15
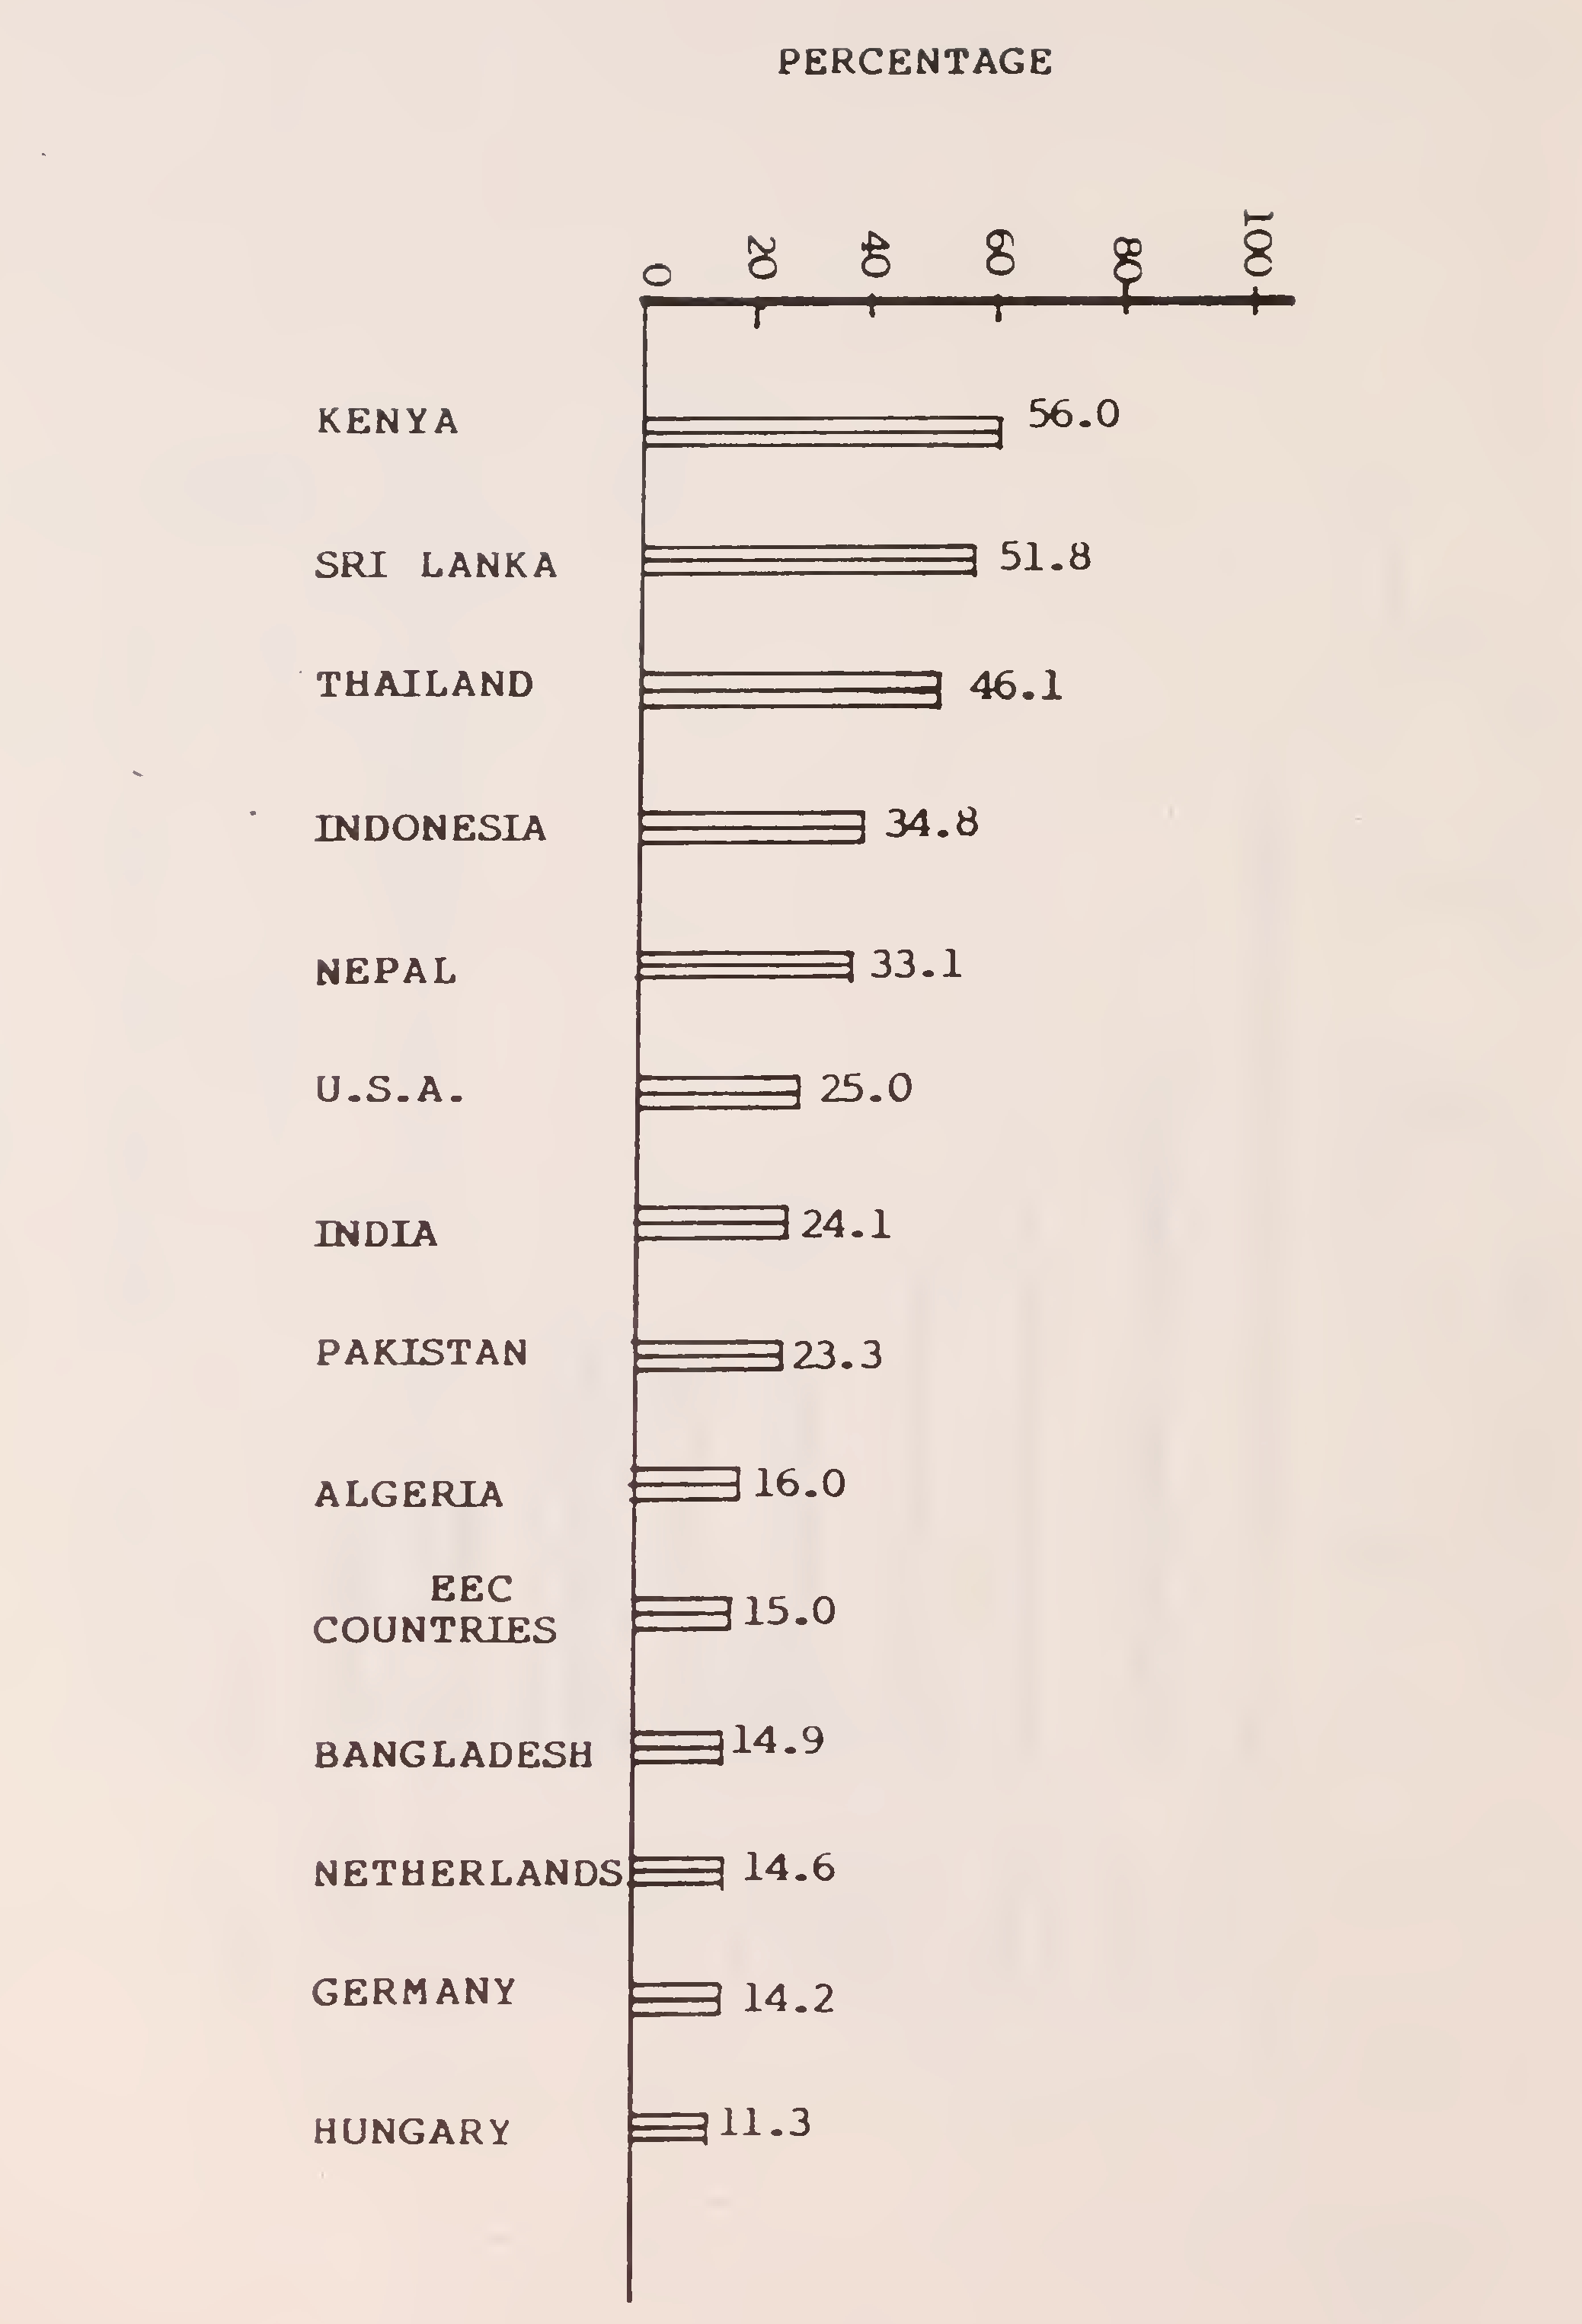
Fig. 11. Percentage share of transport sector in total commercial energy consumption in some selected countries16
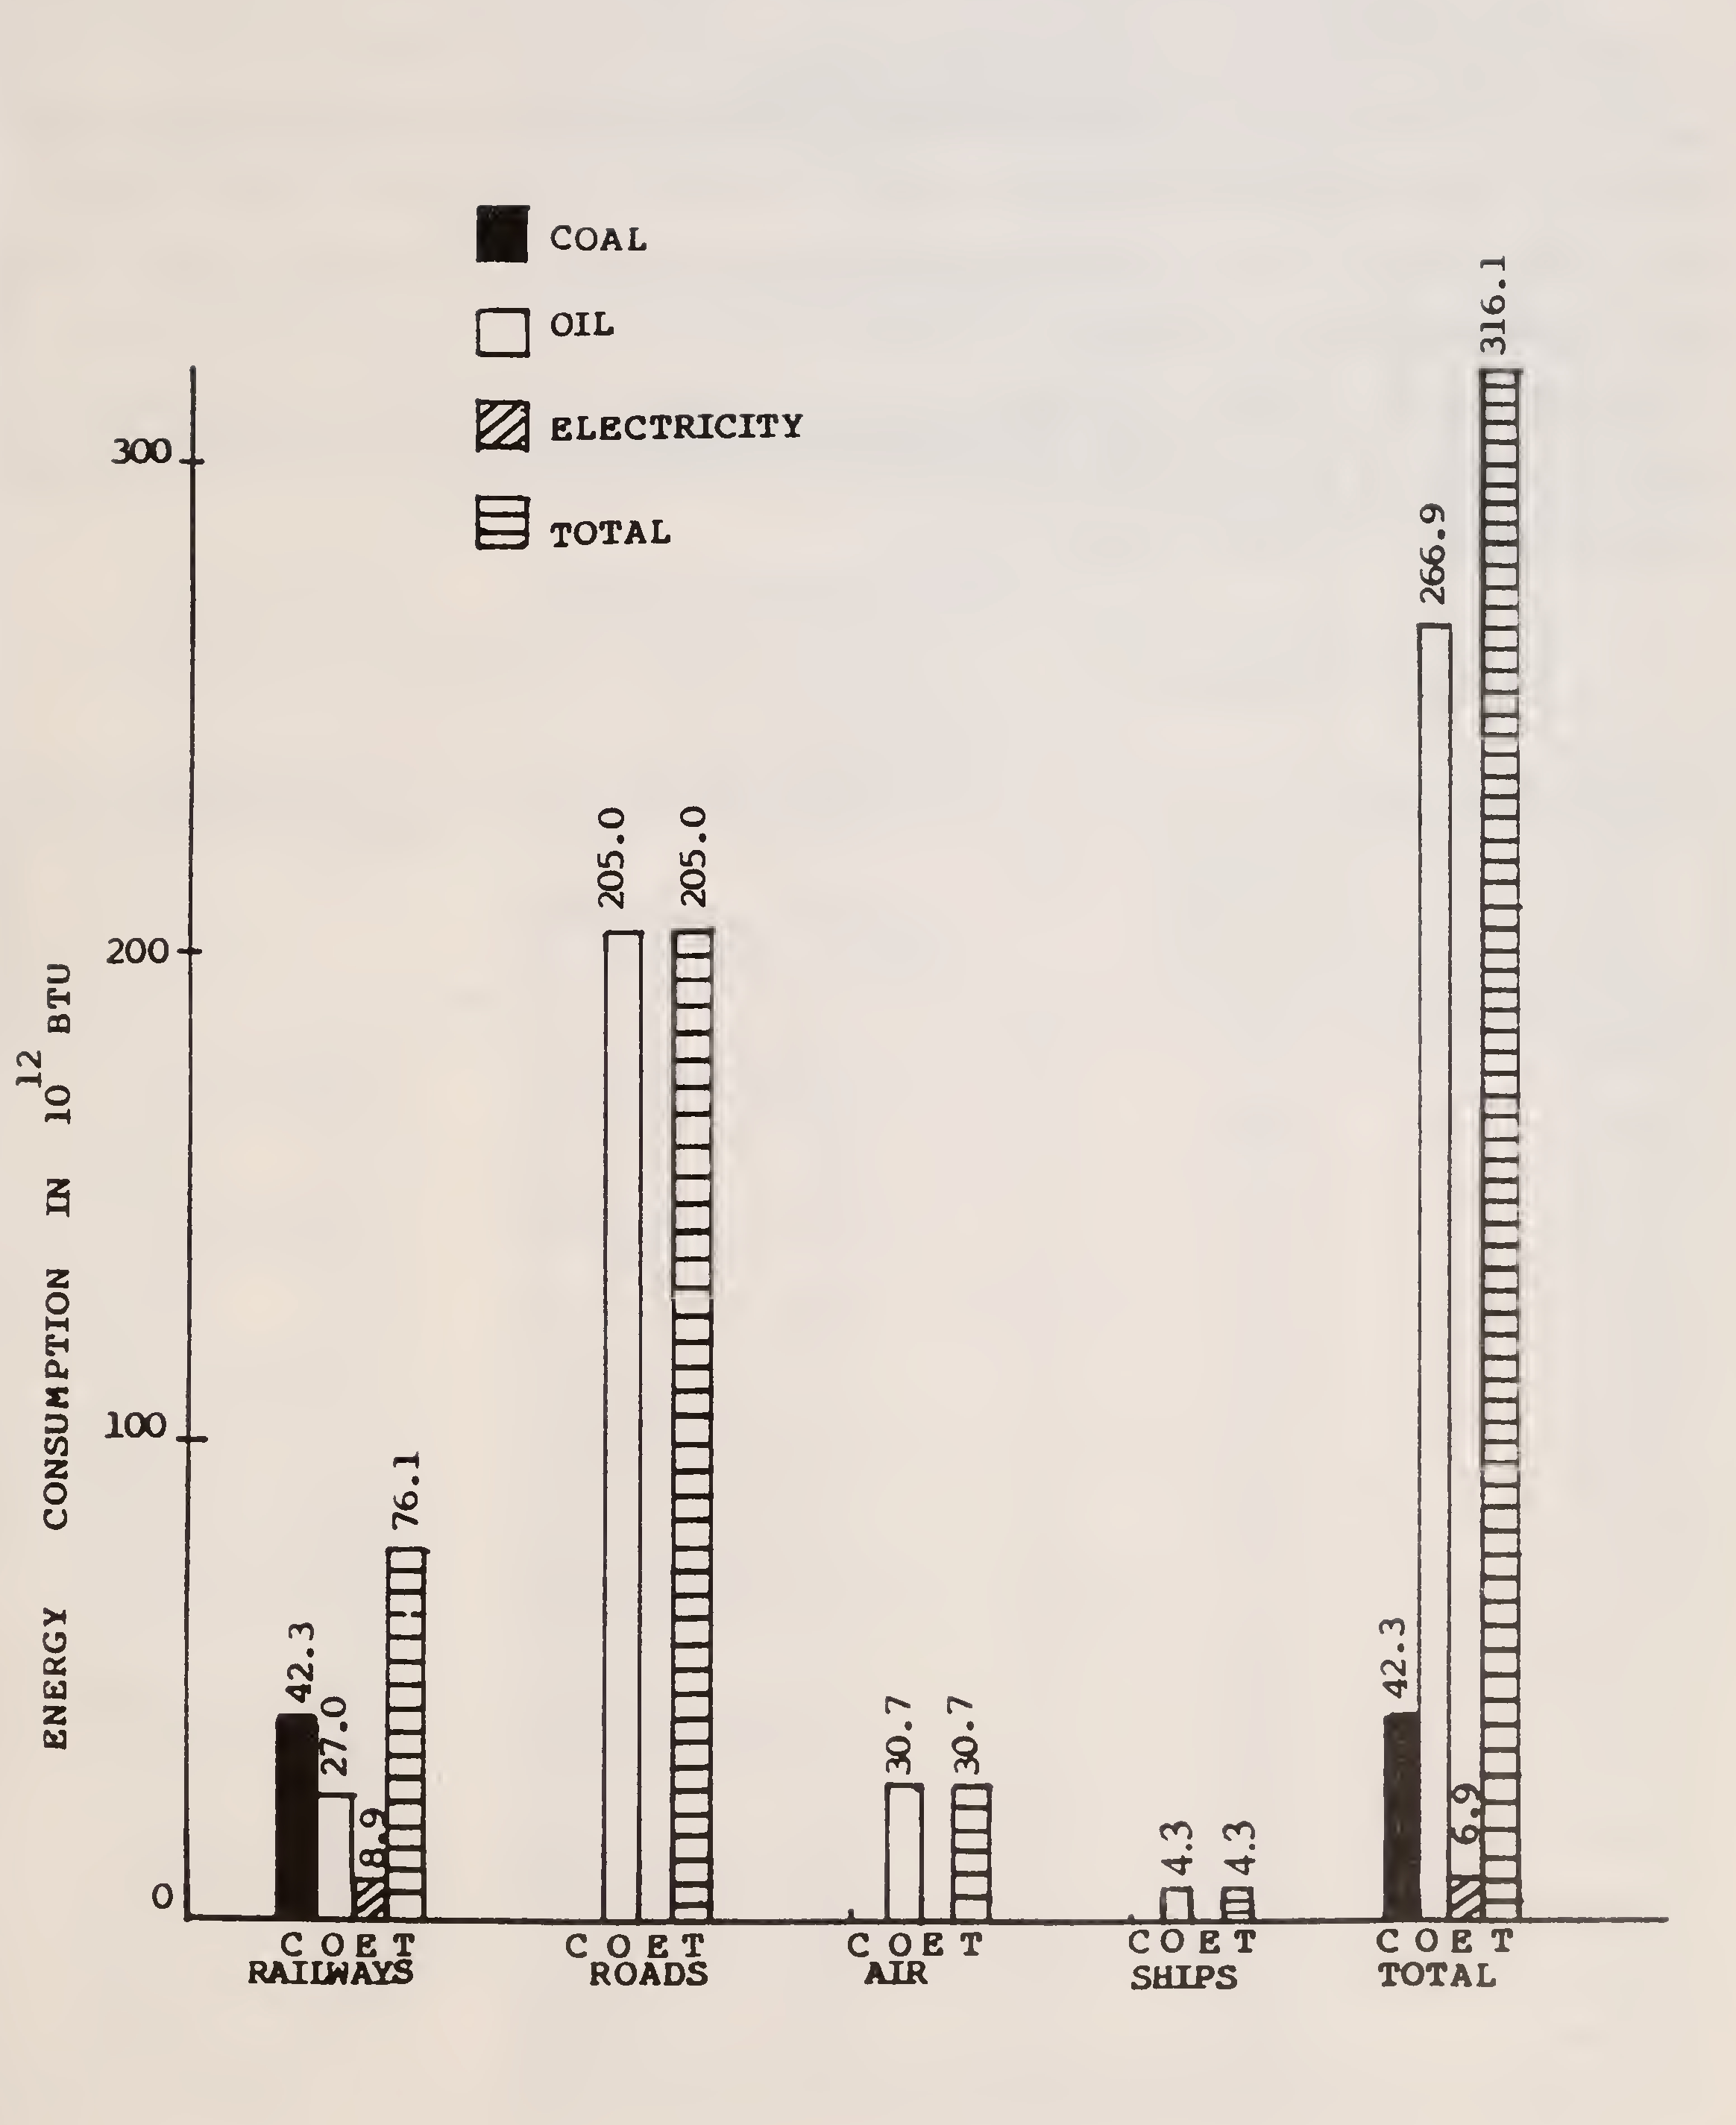
Fig. 12. Share of energy sources in transport in India17
consumed in the transport sector and 77 per cent of the total oil consumed in the transport sector. Thus, oil for road transport represents nearly 16 per cent of the total energy consumed in all sectors in the country.
The population of registered motor vehicles in India is given in Table 1. The major products used in road transport are petrol and diesel oil. Petrol was the first fuel to be introduced when the internal combustion engine made its entry. Cars and two-wheelers still use petrol. With the sudden spurt in the production of two and three wheeler vehicles in the recent past, their fuel consumption accounts to about 60 per cent of petrol consumed by vehicles in the country. Diesel was introduced much later following the development of an efficient fuel injection system. Since then it has become very popular for trucks and buses.
| Passenger cars, jeeps and taxis | Buses | Trucks | Two wheelers | Others | Total | |
|---|---|---|---|---|---|---|
| 1960-61 | 310 | 57 | 168 | 88 | 42 | 665 |
| 1970-71 | 682 | 94 | 343 | 576 | 170 | 1865 |
| 1980-81 | 1117 | 154 | 527 | 2528 | 847 | 5173 |
| 1981-82 | 1207 | 164 | 587 | 2963 | 922 | 5844 |
| 1982-83 | 1351 | 178 | 648 | 3512 | 1025 | 6719 |
| 1983-84 | 1424 | 196 | 719 | 4234 | 1168 | 7759 |
| 1984-85 | 1540 | 213 | 783 | 4960 | 1287 | 8796 |
| 1985-86 | 1627 | 230 | 848 | 5798 | 1379 | 9882 |
| 1986-87 | 1731 | 246 | 902 | 6749 | 1417 | 11045 |
| 1987-88 | 2055 | 260 | 1015 | 8493 | 1663 | 13486 |
| 1988-89 | 2284 | 293 | 1140 | 10685 | 2086 | 16488 |
| 1989-90 | 2733 | 312 | 1289 | 12525 | 2314 | 19173 |
| 1990-91 | 2953 | 332 | 1356 | 14200 | 2533 | 21374 |
| 1991-92 | 3205 | 358 | 1514 | 15661 | 2769 | 23507 |
| 1992-93 | 3344 | 380 | 1592 | 17060 | 2970 | 25346 |
| 1993-94 | 3617 | 419 | 1650 | 18338 | 3203 | 27227 |
Fig. 13 gives the percentage share of petrol and diesel in some selected countries in the world. In the developed countries, where the use of cars is18
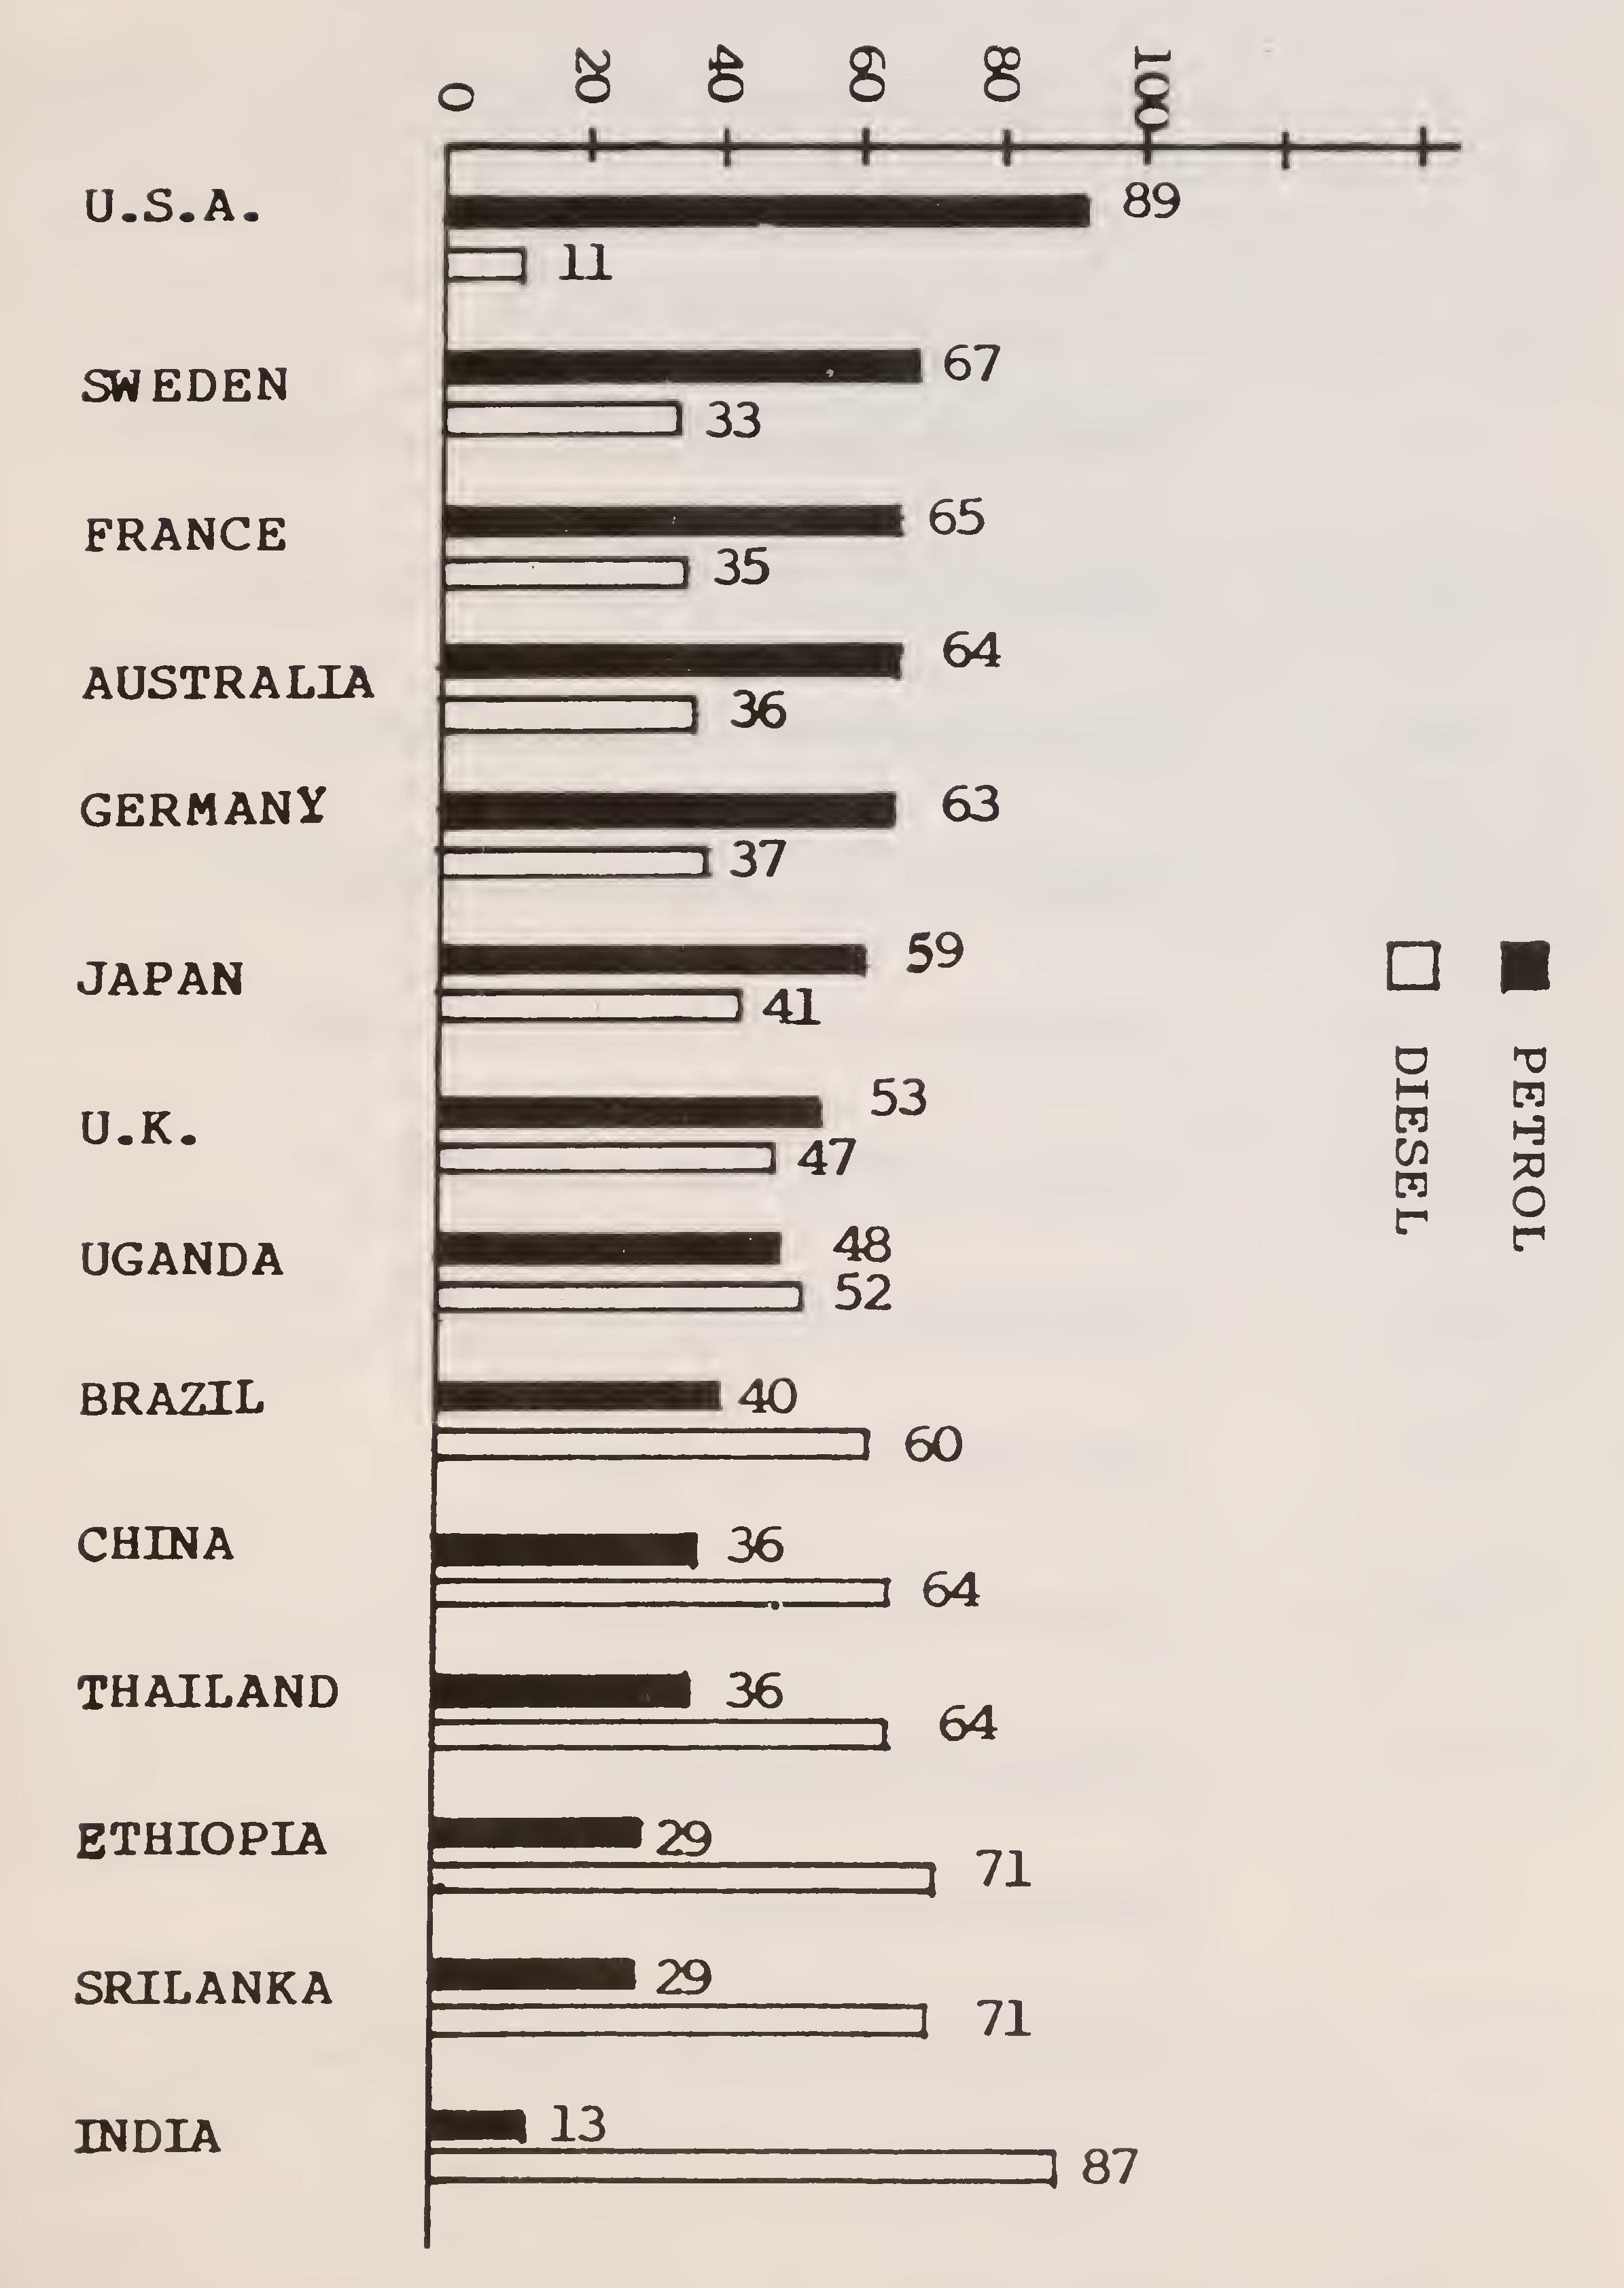
Fig. 13. Percentage share of petrol and diesel consumption in some selected countries19
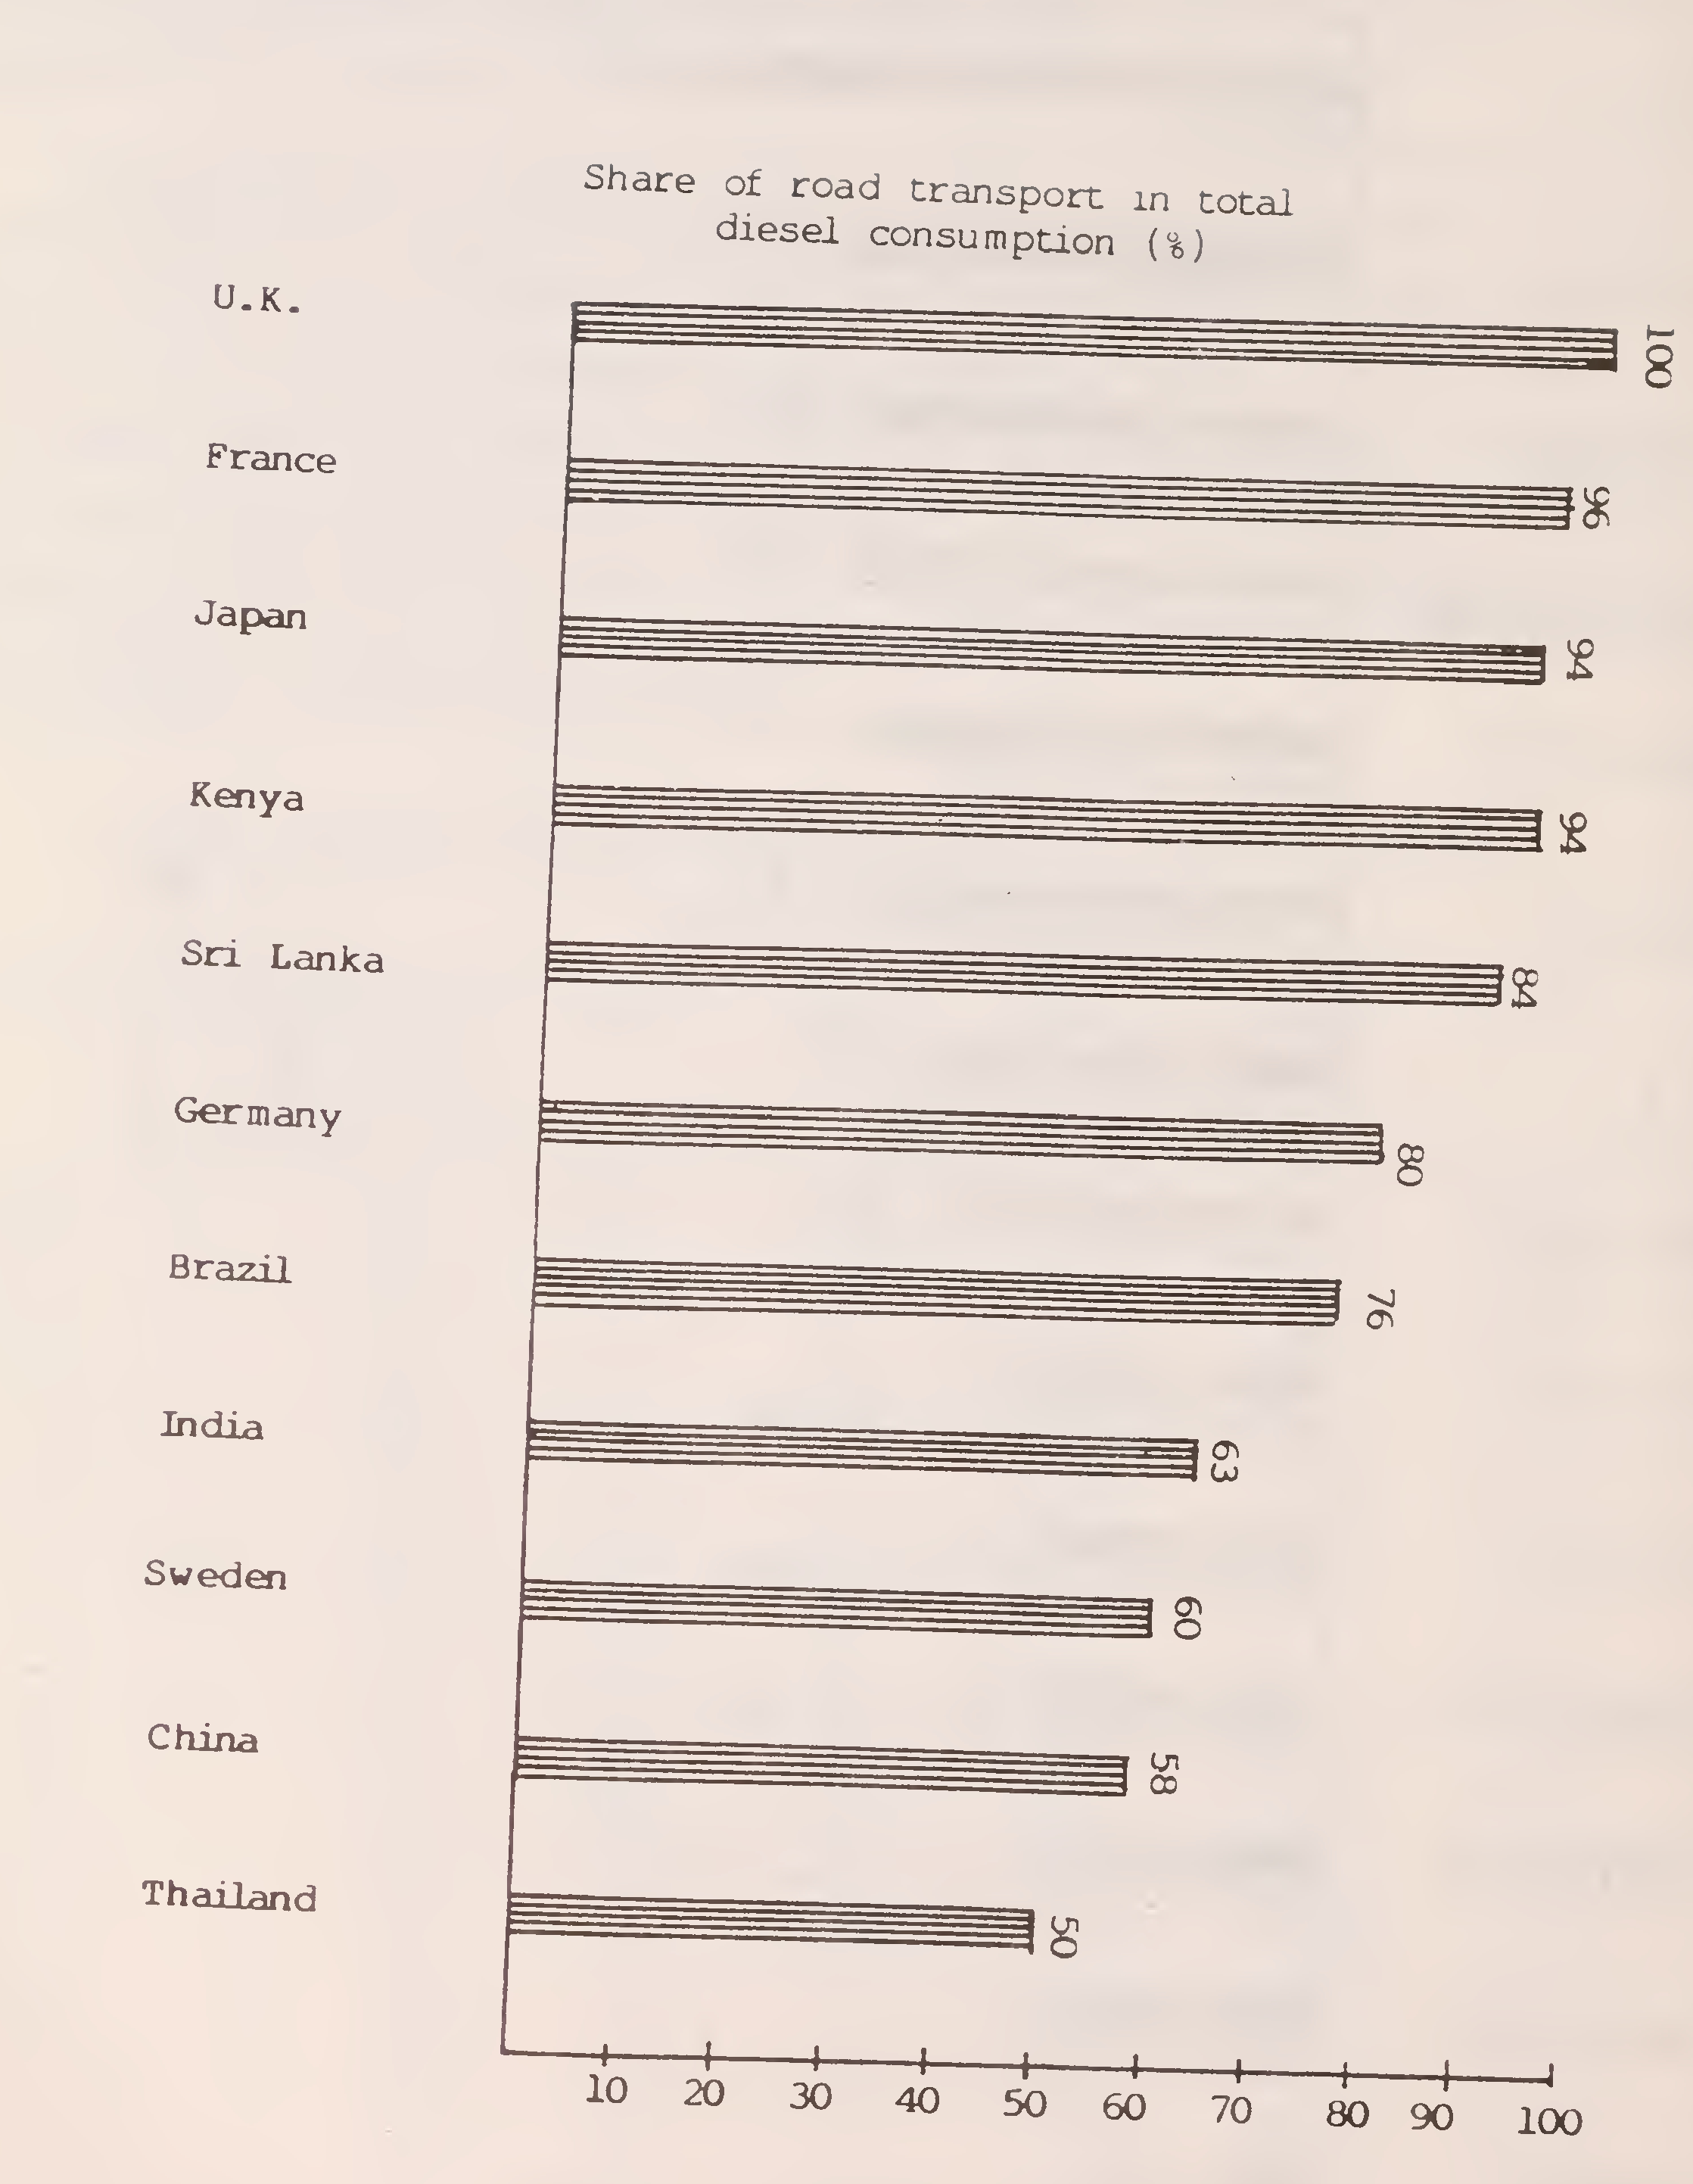
Fig. 14. Share of road transport in total diesel consumption in selected countries20
common for personal movement, the share of petrol is high. In U.S.A., for example the share is 89 per cent. The position in developing countries is just the reverse, with a high percentage of diesel consumption and a low percentage of petrol consumption. In India, for example, the diesel share is 87 per cent and the petrol share is 13 per cent. This is because of the emphasis on public transport in buses and the low car-ownership.
Fig. 14 gives the percentage of diesel consumed in road transport in some selected countries. In India, 63 per cent of the total diesel consumed is in the road transport sector. Considerable diesel is used in India in the agricultural sector, particularly for irrigation by means of diesel pump sets. In view of growing oil-shortages, it would be prudent to encourage the gradual replacement of such pump-sets by electrical pump-sets. This would make diesel available to the road transport sector, which has no such alternative.
The high share of diesel (and kerosene for domestic cooking and lighting) in India places heavy dependence on middle distillates. Since the quantity of middle distillates is fixed per barrel of oil refined, the high consumption of diesel will be bound to create difficulties in the refining process. Ultimately, the country may have to swap some of the products or import some.
There is some increase in the commercial intensity of the transport sector since the early 1970s. It is attributed generally due to larger share of traffic handled by the road sector especially by trucks hauling goods to longer distances. The second contributing factor is the rapid growth of energy intensive modes like taxis/cars/two and three wheelers vis-a-vis public modes like buses/coaches/mini-buses.
The passenger mode energy intensities are given in Fig. 15 and the freight mode energy intensities are given in Fig. 16. The comparison brings out glaringly that steam locomotives are extremely inefficient and should be phased out. The personalised modes (cars and scooters) consume excess fuel per passenger-Km to buses. Diesel and electric rail propulsion is many times more energy efficient than diesel trucks. Barges and pipe-lines hold much promise for future development.21
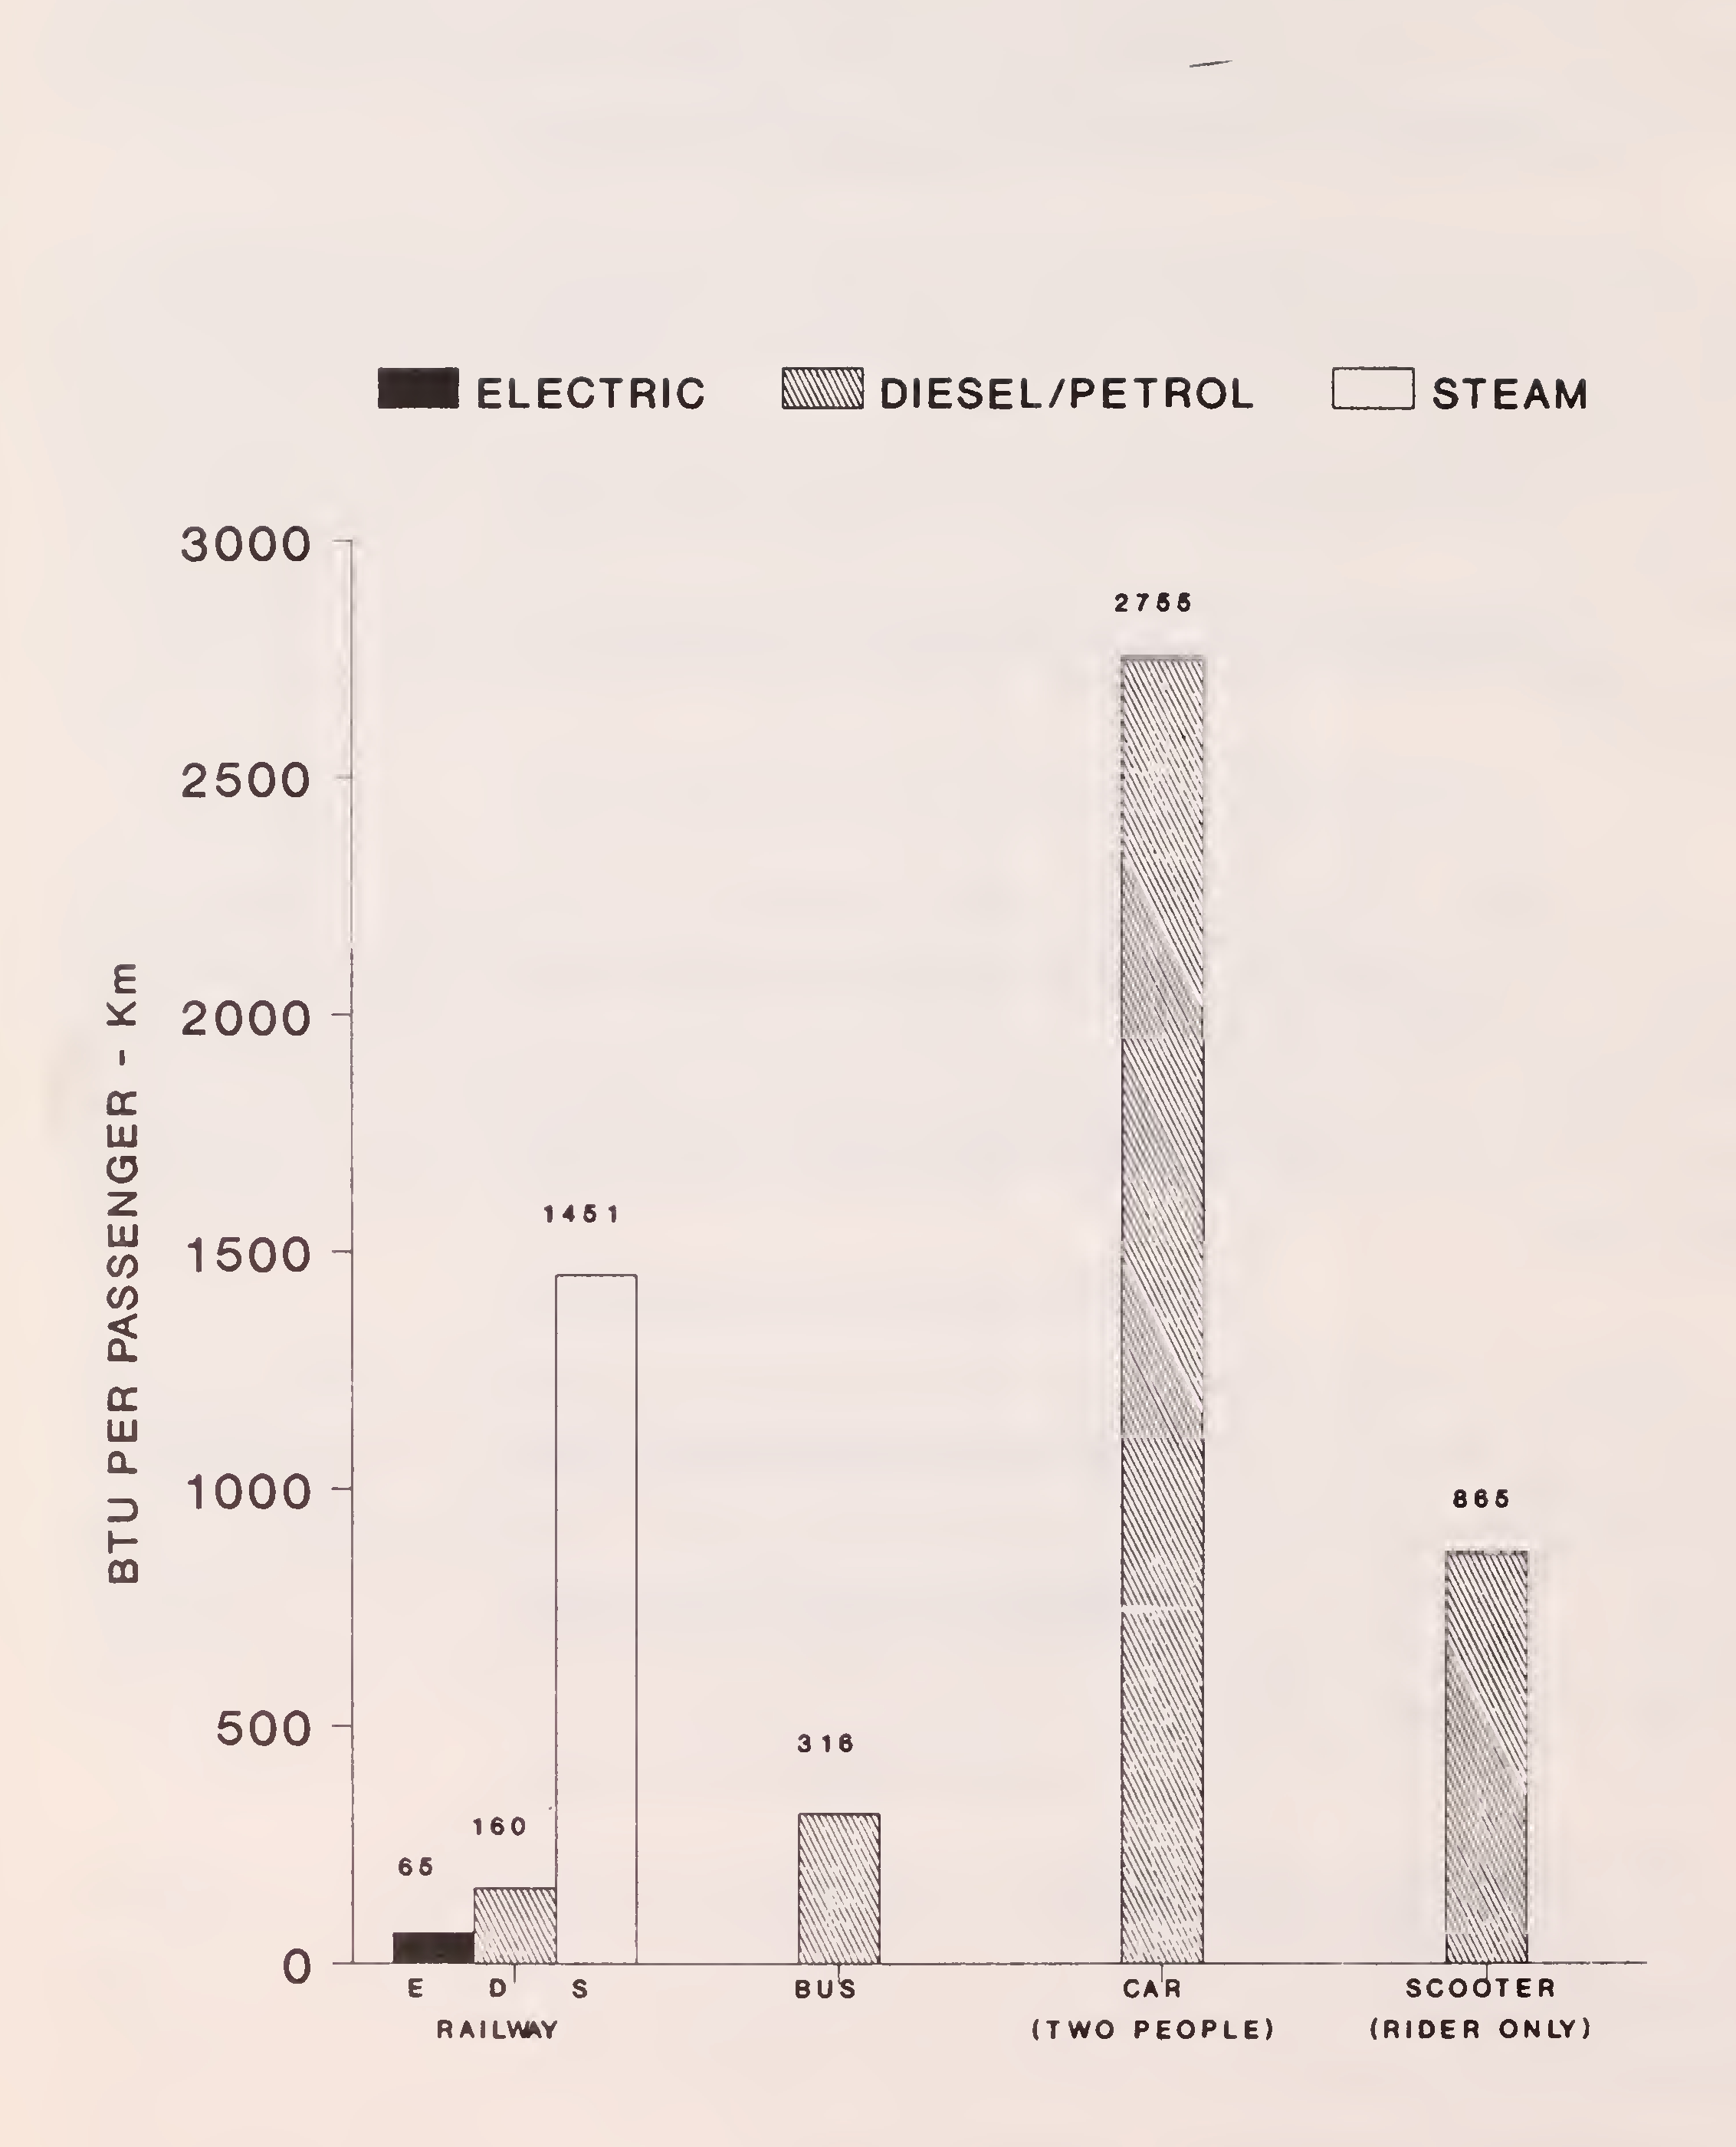
Fig. 15. Passenger mode energy intensities22
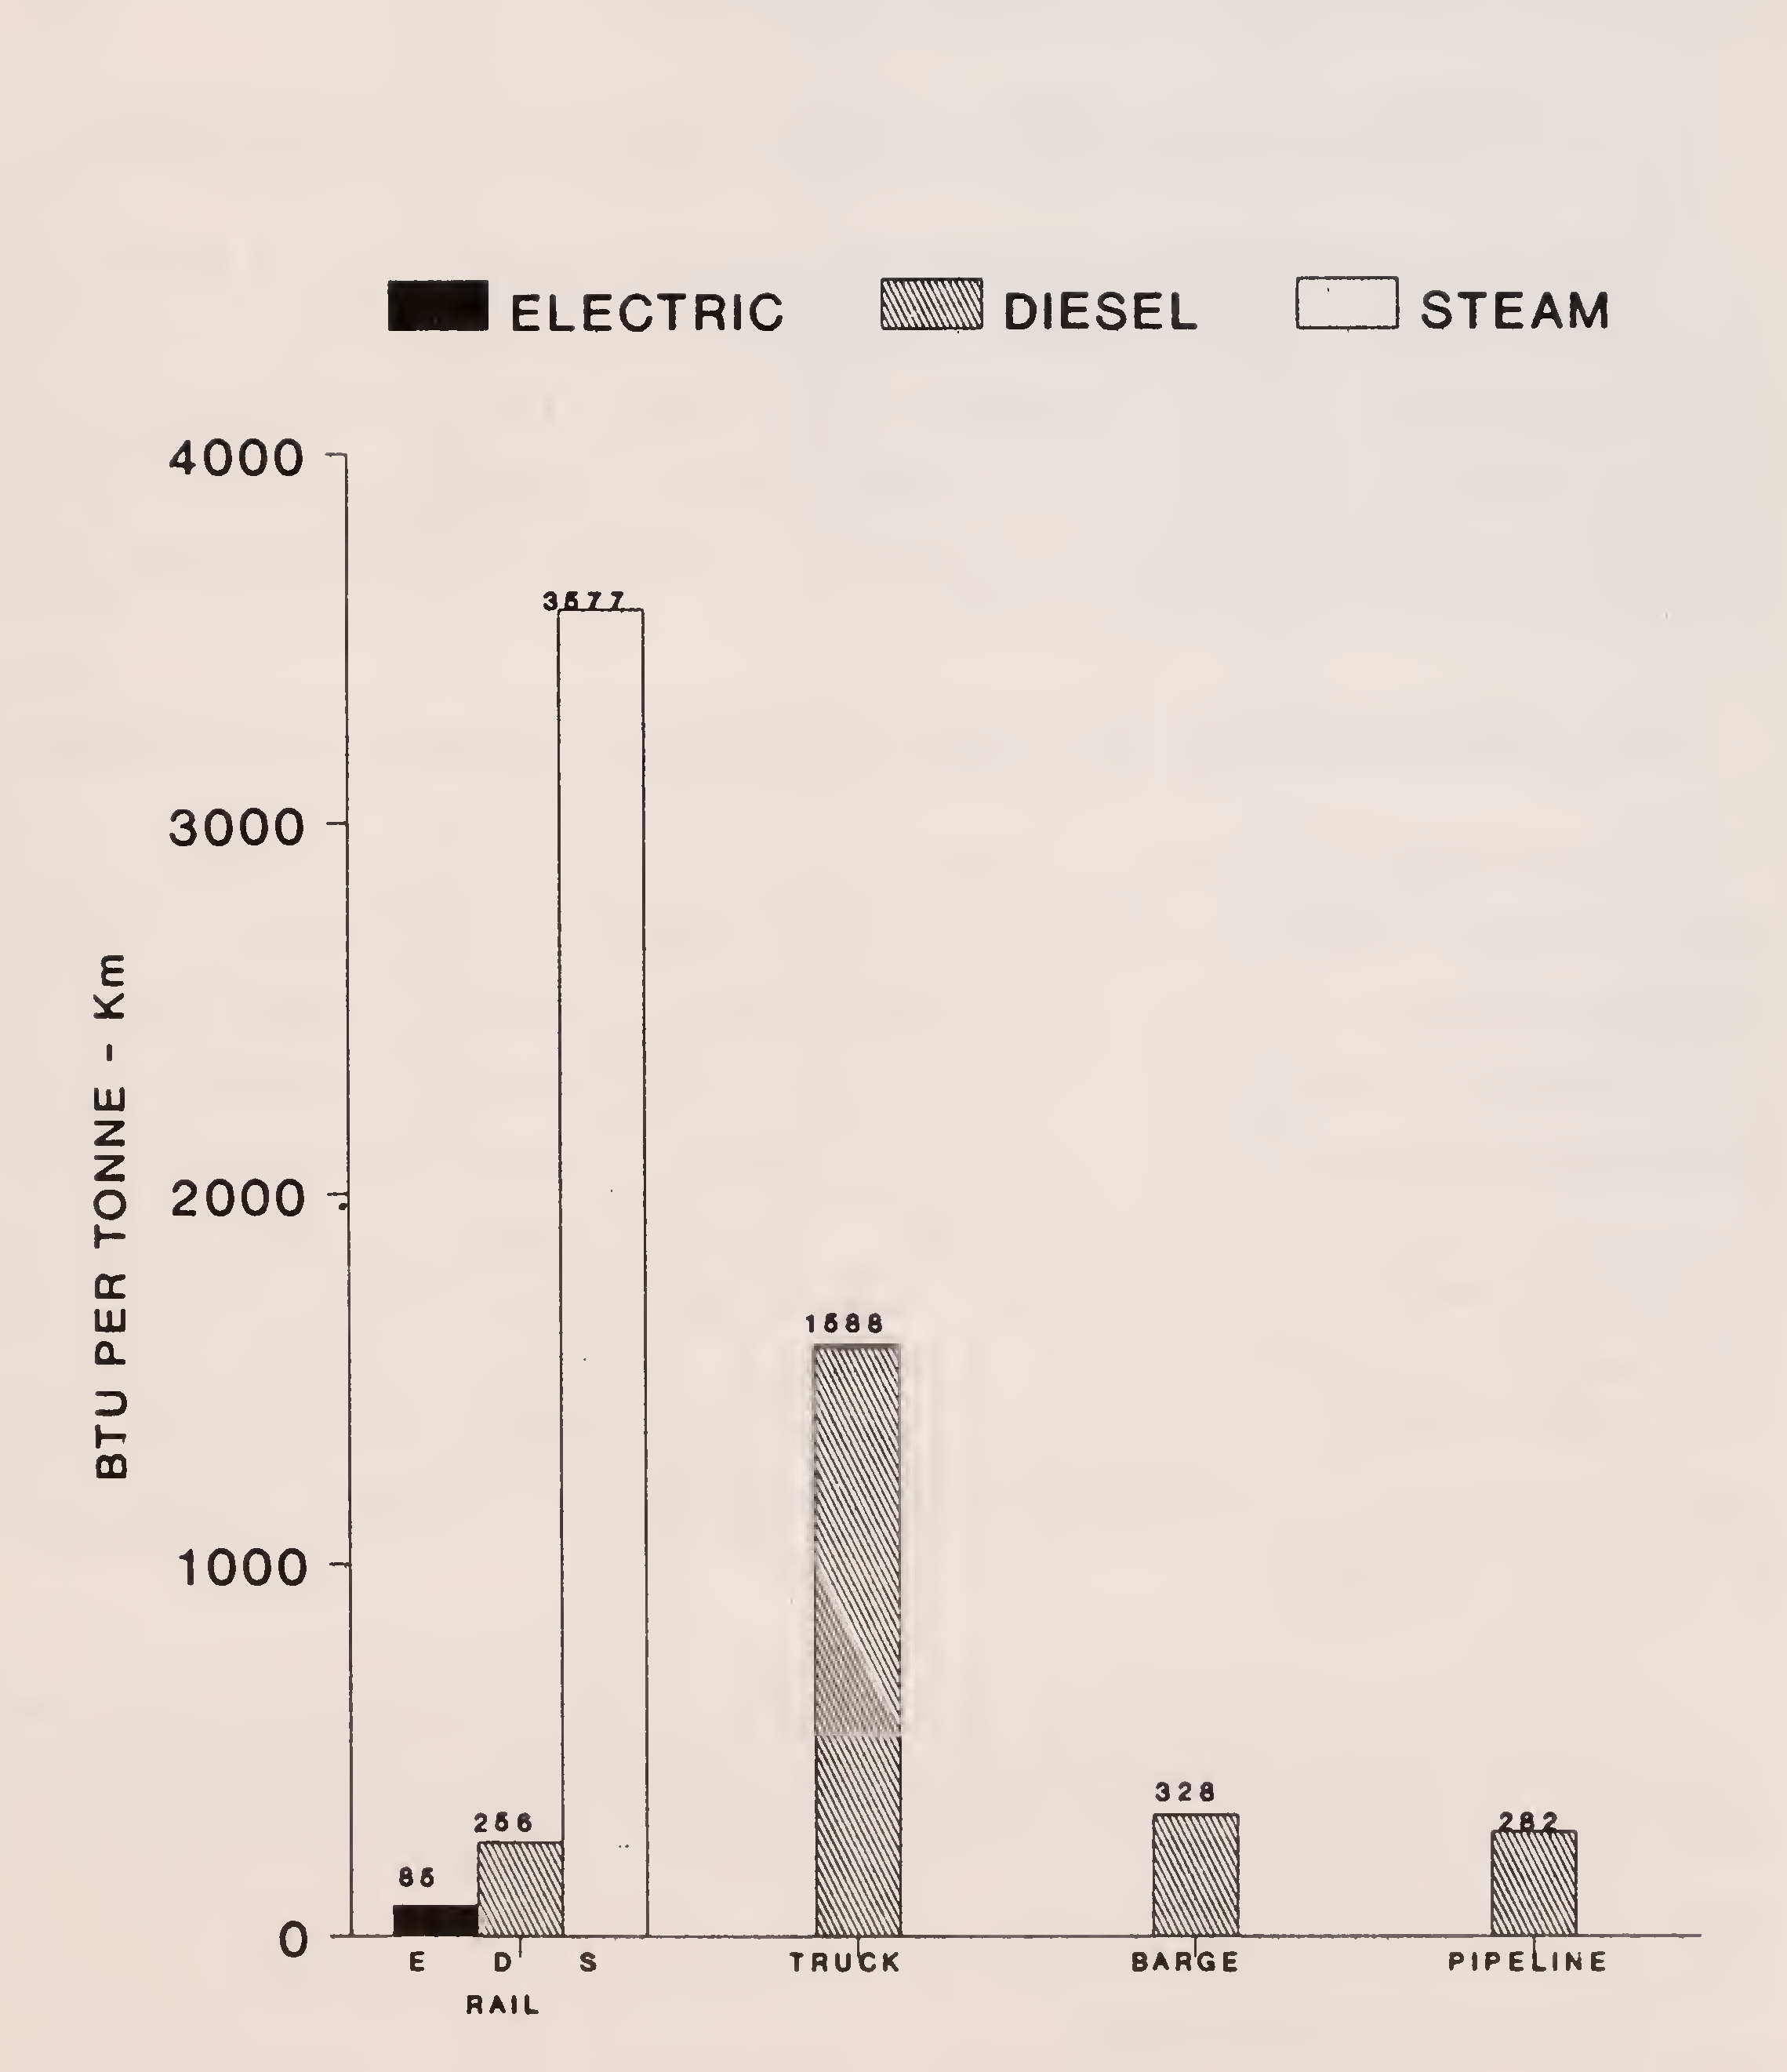
Fig. 16. Freight mode energy intensities23
Liquid fuel as discussed above, is not going to last for more than 3 to 4 decades from now onwards and therefore the bitumen which is a byproduct of oil shale deposit is going to be in acute shortage and eventually may not be even available for the purpose of repairs of asphalt pavements. As a strategy there should be an emphasis on the construction of roads using indigenous material. It is appropriate to make a mention that constructions using cement provides a promising alternative.
Since road transport uses bulk of the liquid fuels of which India is in short supply, conservation of energy in this sector must be accorded very high priority. Various measures are possible, many of them simple and easy to implement. Already many countries have adopted some of them and stabilised the fuel consumption almost at a constant level inspite of steady growth in road transport activities.
Road vehicles have to overcome the friction at the tyre-road interface when moving. The smoother the surface, the less is the energy needed to overcome friction. It can be seen from Table 2 that more than 50 per cent of road length is unsurfaced contributing to loss of energy. The riding quality of a surface is measured by various methods. The one adopted in India is by means of the Towed Fifth Wheel Bump Integrator. The roughness recorded by this instrument is in terms of upward movement caused when it is towed at a constant speed of 32 km/hr. It is measured in mm/km. Different surfaces have different values of roughness, and different levels of maintenance give different values of roughness for the same type of surface. Table 3 gives the common values.
The effect of roughness on fuel consumption of vehicles has been studied in India through controlled experiments. Figs. 17 and 18 give the results for a car and a 10 T two-axled truck when driving at an optimum speed of around 40 km/hr.
The results show that :
| (Length in ‘000) | ||||
|---|---|---|---|---|
| Surfaced | Unsurfaced | Total | National Highways | |
| 1960-61 | 234 | 471 | 705 | 23 |
| 1971-72 | 436 | 576 | 1012 | 28 |
| 1972-73 | 474 | 654 | 1128 | 29 |
| 1973-74 | 499 | 672 | 1171 | 29 |
| 1974-75 | 523 | 692 | 1215 | 29 |
| 1975-76 | 551 | 698 | 1249 | 29 |
| 1976-77 | 572 | 736 | 1308 | 29 |
| 1977-78 | 596 | 776 | 1372 | 29 |
| 1978-79 | 622 | 823 | 1445 | 29 |
| 1979-80 | 647 | 846 | 1493 | 29 |
| 1980-81 | 684 | 807 | 1491 | 32 |
| 1984-85 | 788 | 899 | 1687 | 32 |
| 1985-86 | 825 | 901 | 1726 | 32 |
| 1986-87 | 858 | 922 | 1780 | 32 |
| 1987-88 | 888 | 955 | 1843 | 32 |
| 1988-89 | 920 | 985 | 1905 | 33 |
| 1989-90 | 960 | 1010 | 1970 | 34 |
| (in mm/km) | |||||
|---|---|---|---|---|---|
| Surface Type | Road Condition | ||||
| Good | Average | Poor | Very poor | ||
| 1. | Asphaltic concrete | 2000-2500 | 2500-3500 | 3500-4000 | Over 4000 |
| 2. | Primix open-textured carpet | 2500-4500 | 4500-5500 | 5500-6500 | Over 6500 |
| 3. | Surface dressing | 4000-5000 | 5000-6500 | 6500-7500 | Over 7500 |
| 4. | Water bound macadam or gravel | 8000-10000 | 9000-10000 | 10000-12000 | Over 1200025 |
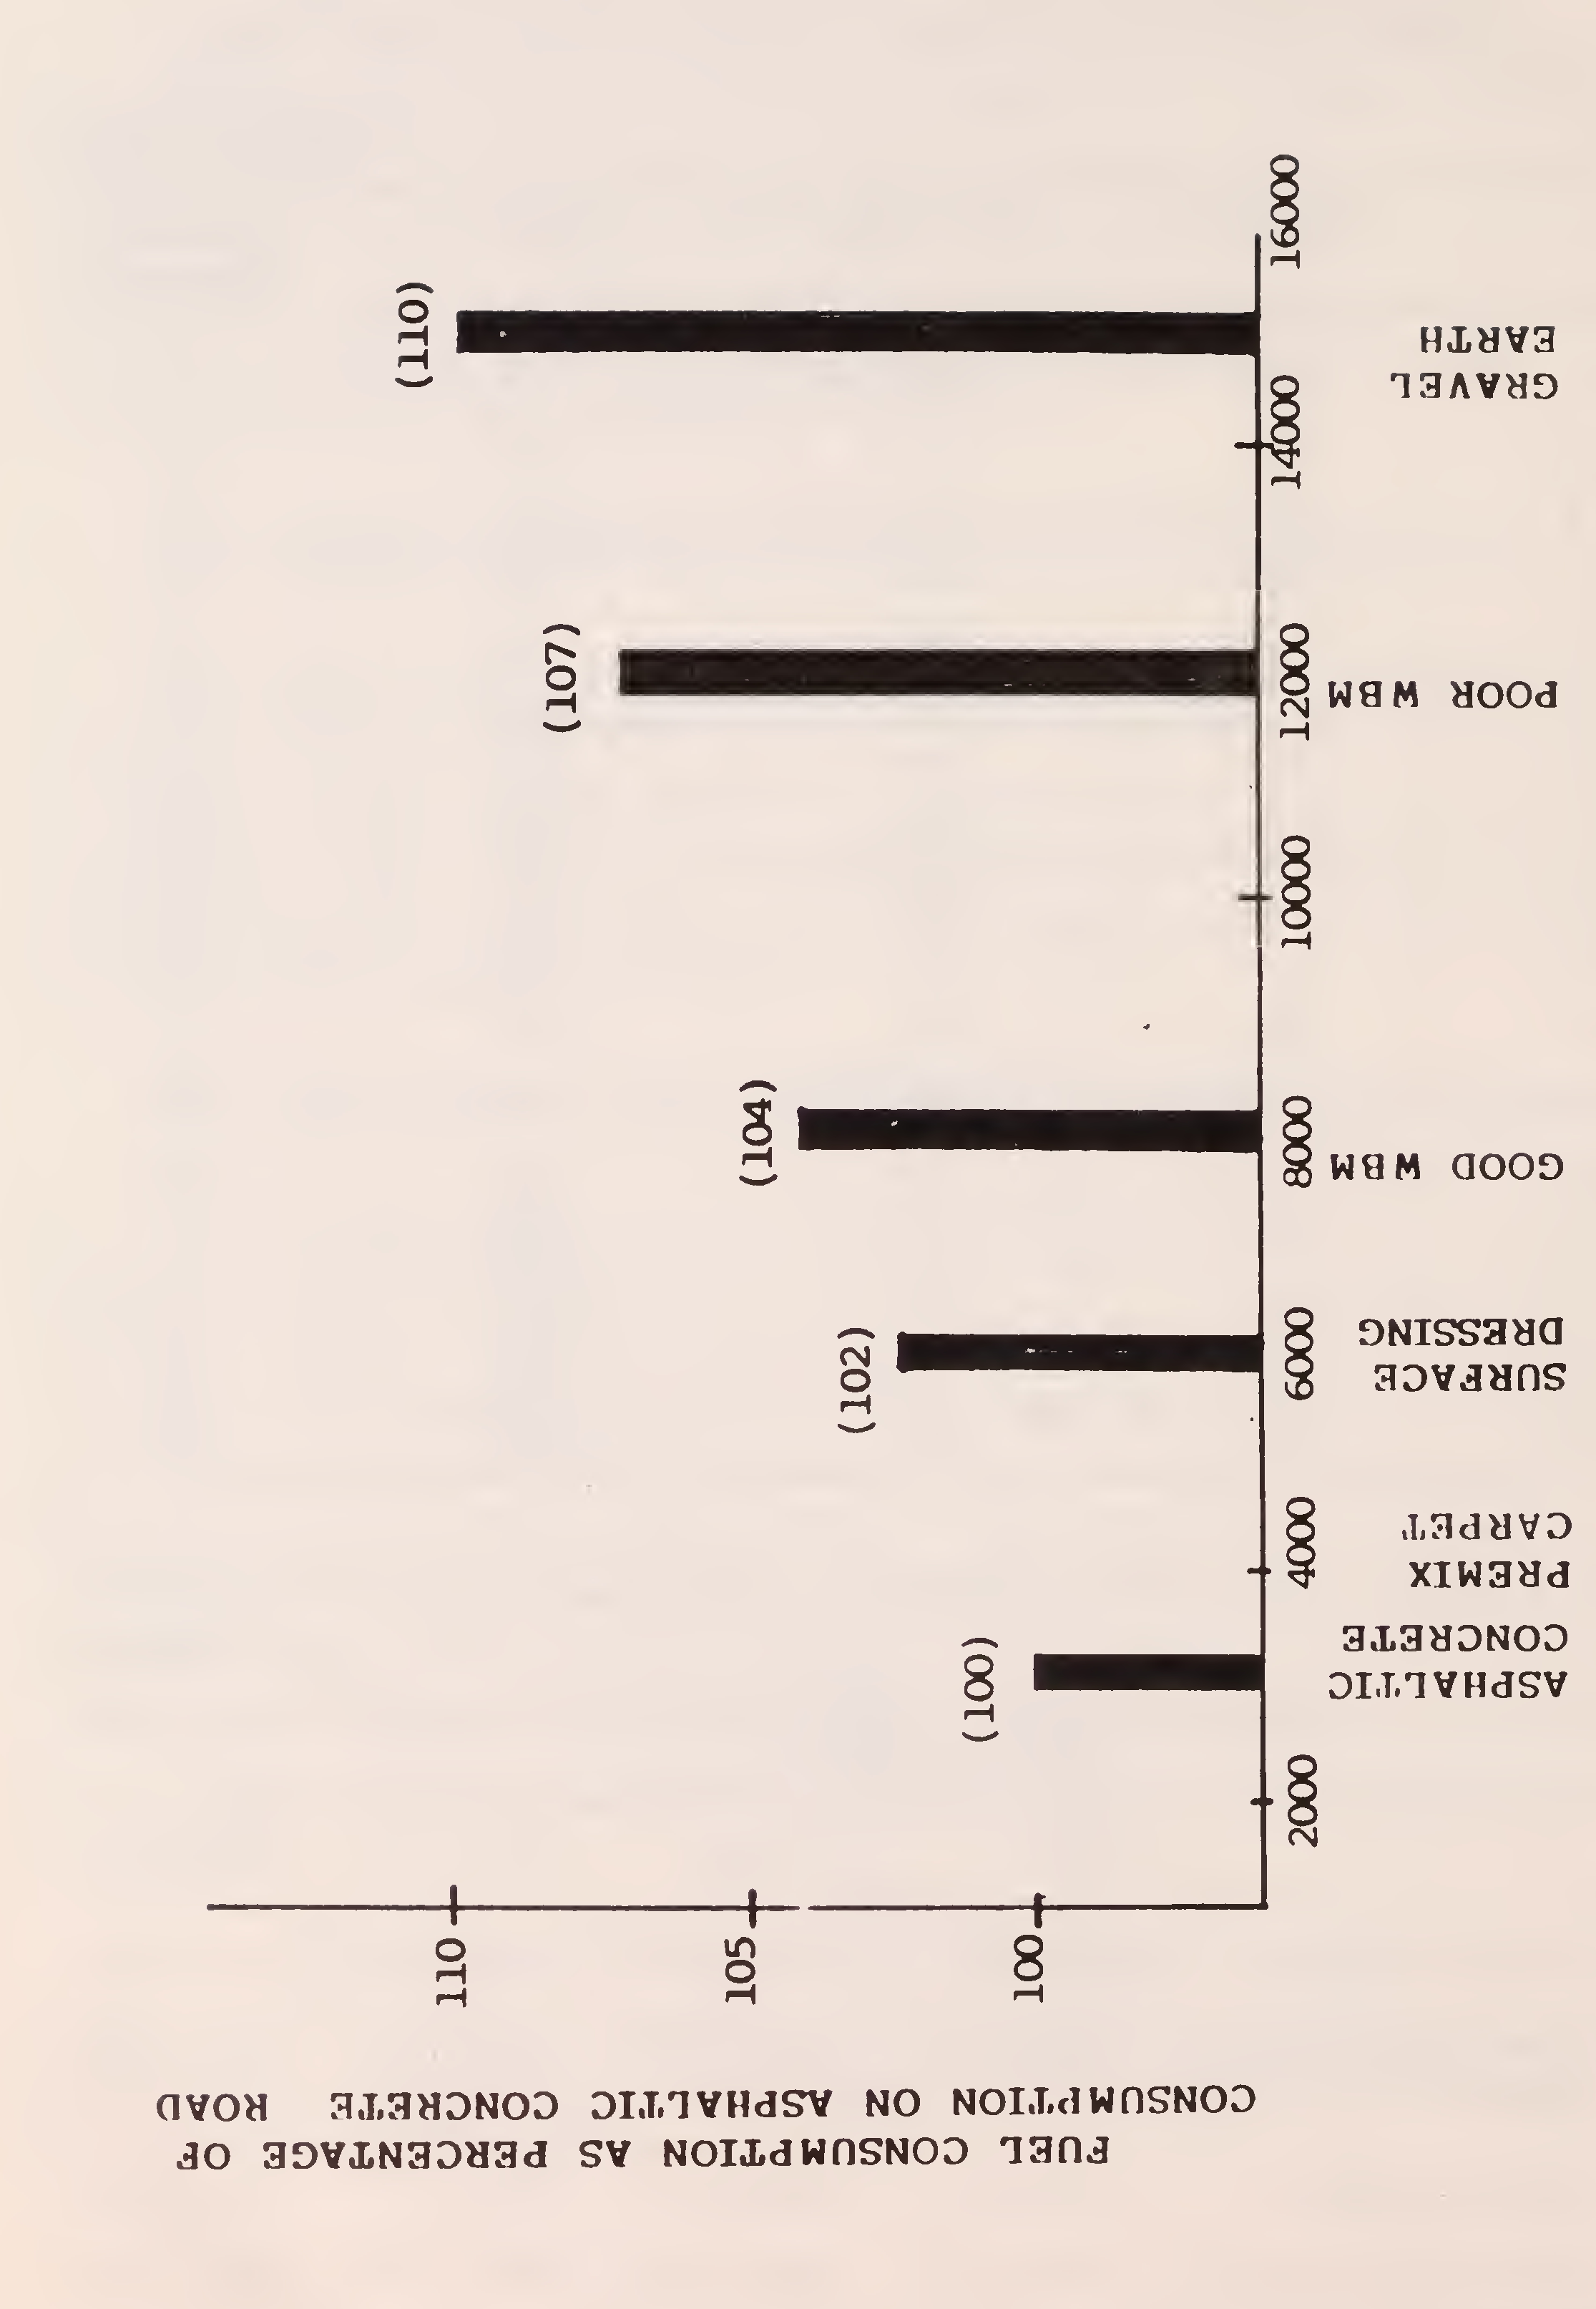
Fig. 17. Fuel consumption of ambassador car on different road surface types26
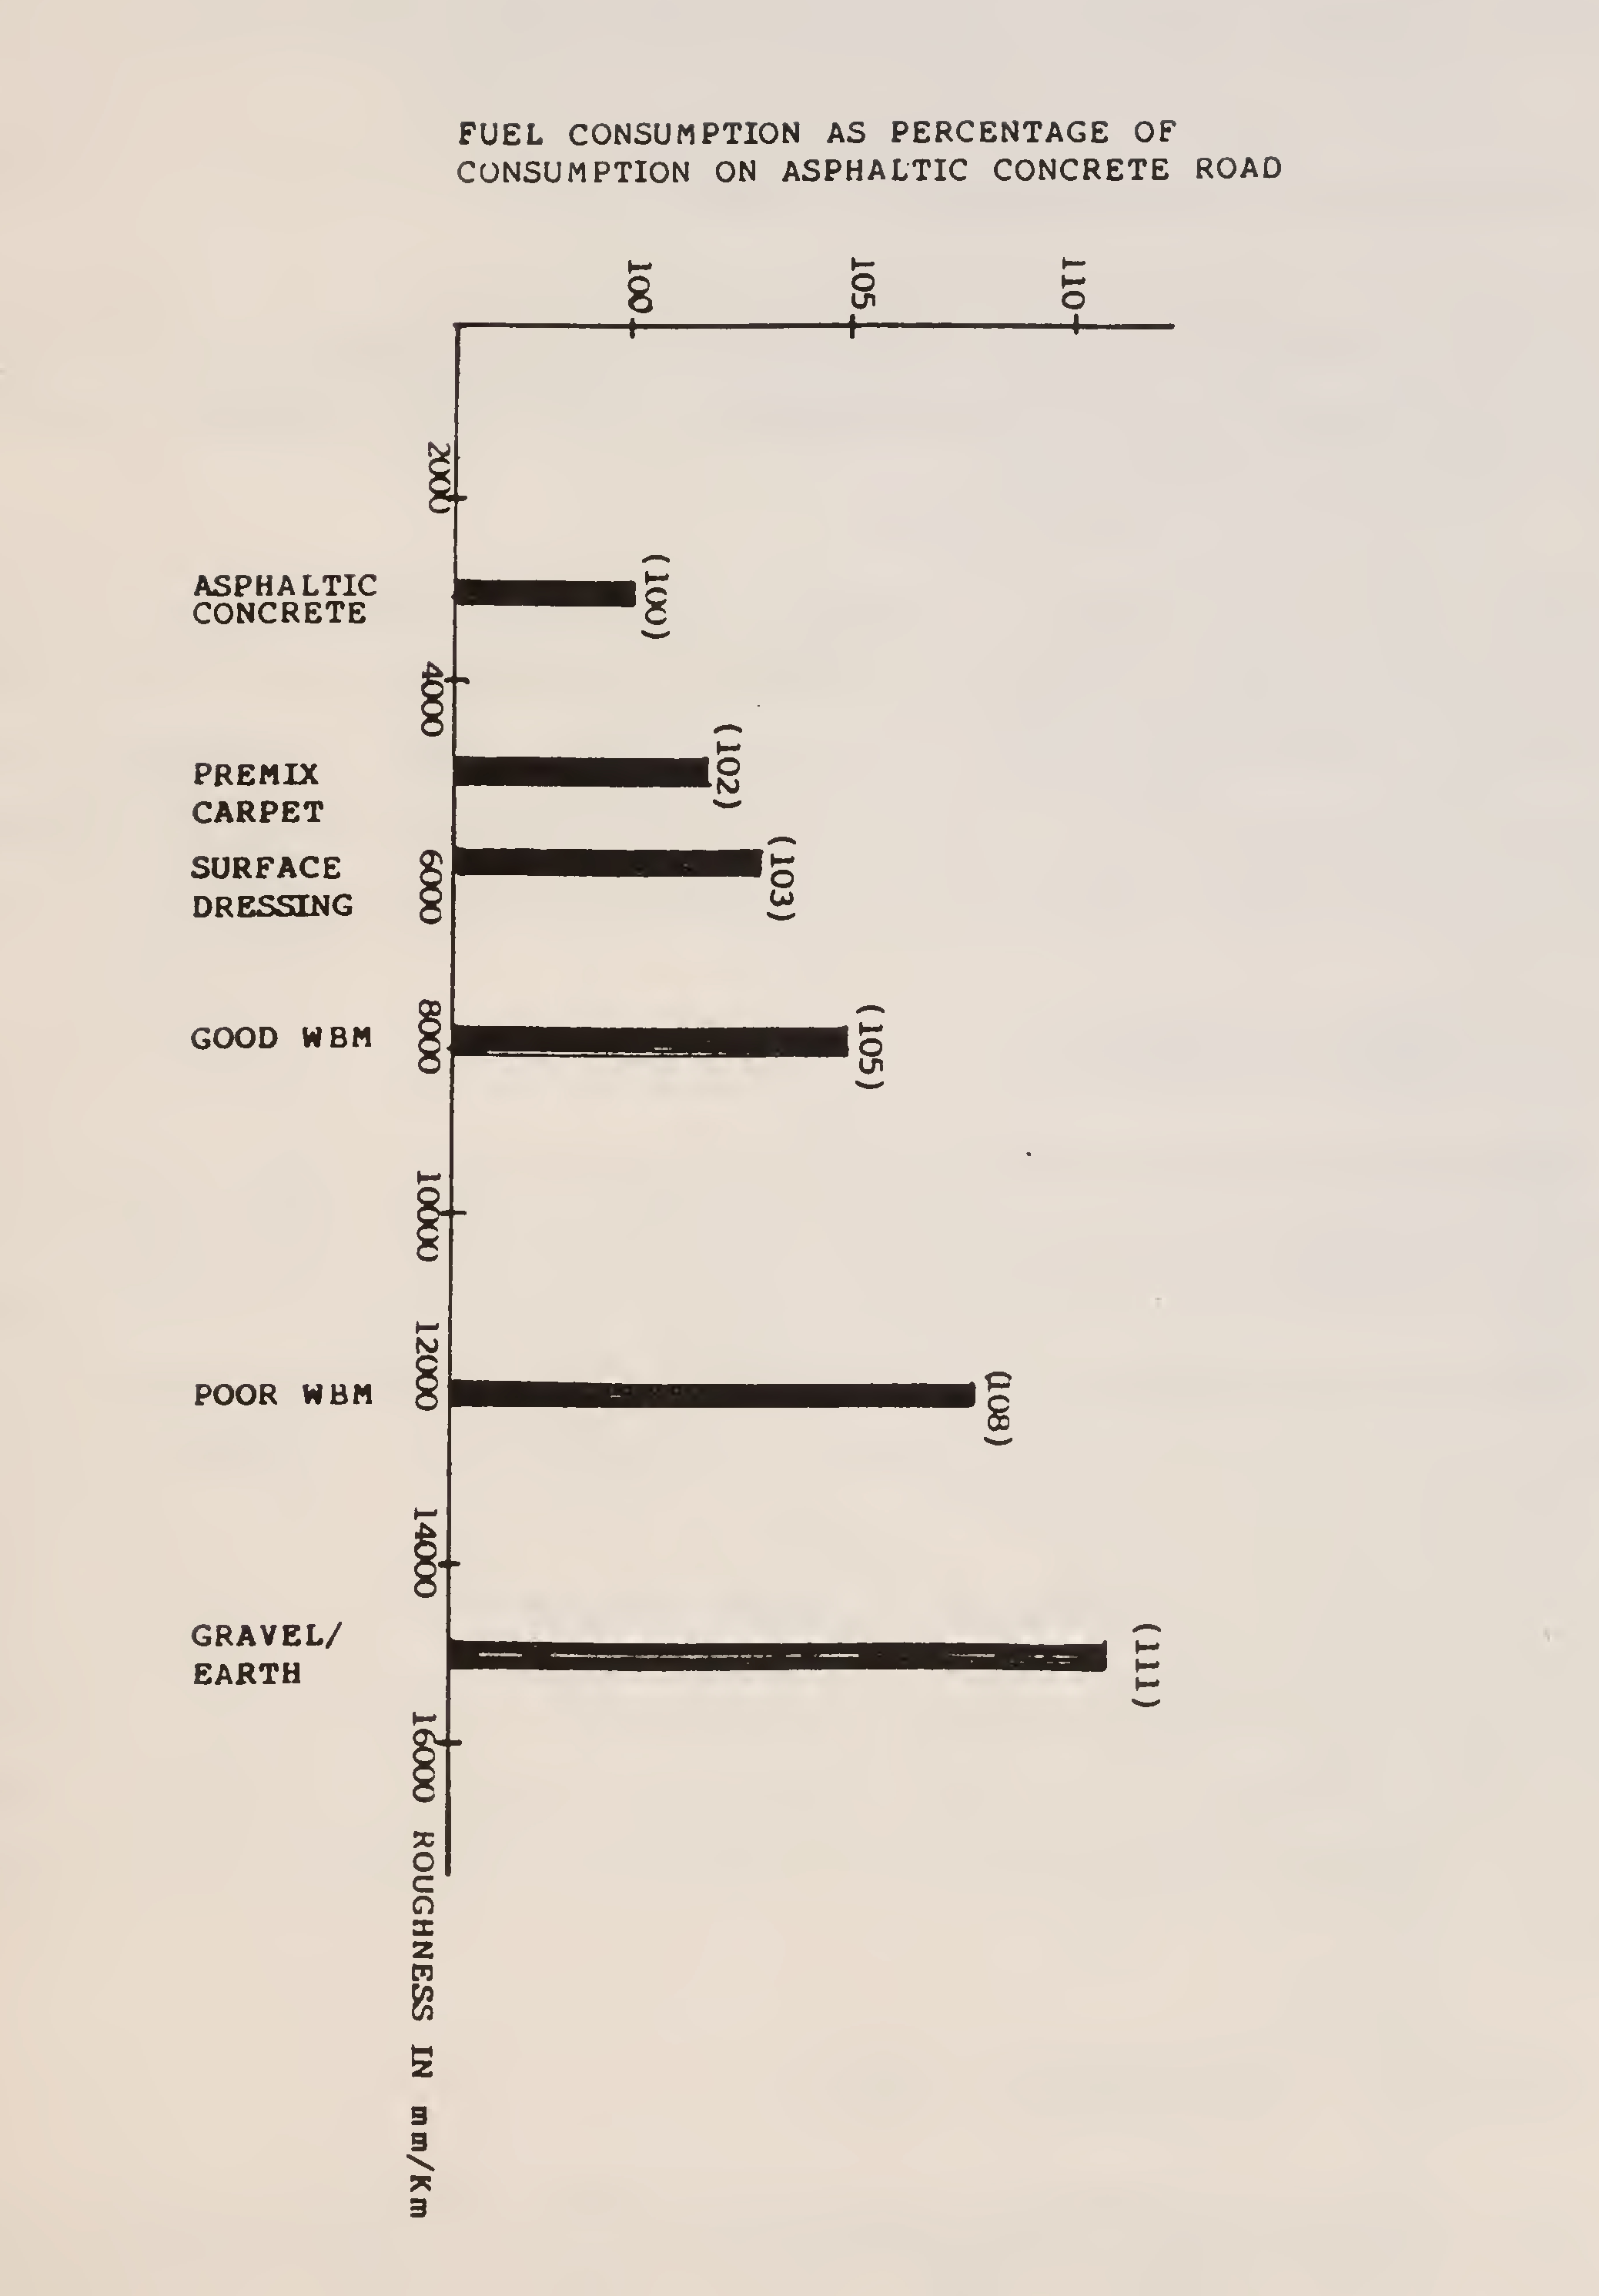
Fig. 18. Fuel consumption of TATA truck on different road surface types27
The load carried by a truck influences fuel consumption significantly. Fig. 19 shows the effect on three truck types moving on an asphaltic concrete surface level road at 40 km/hr.
Each size of a truck is efficient for a particular pay load. The productivity of a truck in terms of Tonne-km per litre increases as the truck size increases. This effect is shown in Figs. 20 & 21. Thus, for carrying large loads, multi-axled trucks and truck-trailer combinations are ideal. Besides achieving fuel economy, such trucks cause less damage to road pavements.
When vehicles travel at low speed, using the first or second gears, fuel consumption is high. As speeds increase, and higher gears are used, the fuel consumption comes down. There is a speed, in the range of 30-50 km/hr, when the fuel consumption is a minimum. It again increases as speeds rise thereafter. The fuel consumption curve is thus typically U-shaped. Figs. 22, 23, 24 and 25 give the trends for various vehicles. It is seen that driving vehicles in a range of speed of 30-50 km/hr results in the minimum fuel consumption. Good driving habit should recognise this pnenomenon. Overspeeding must be discouraged. It is for this reason that soon after the energy crisis in 1973, many countries imposed a speed limit. Given in Table 4 are the optimum speeds and the related fuel consumption for various vehicles.
When the pavement width is inadequate for accommodating the traffic, congestion occurs, forcing the vehicles to move at low speeds and frequently accelerating and decelerating. This results in excess consumption of fuel. This is a serious waste and can be prevented by timely widening of road28
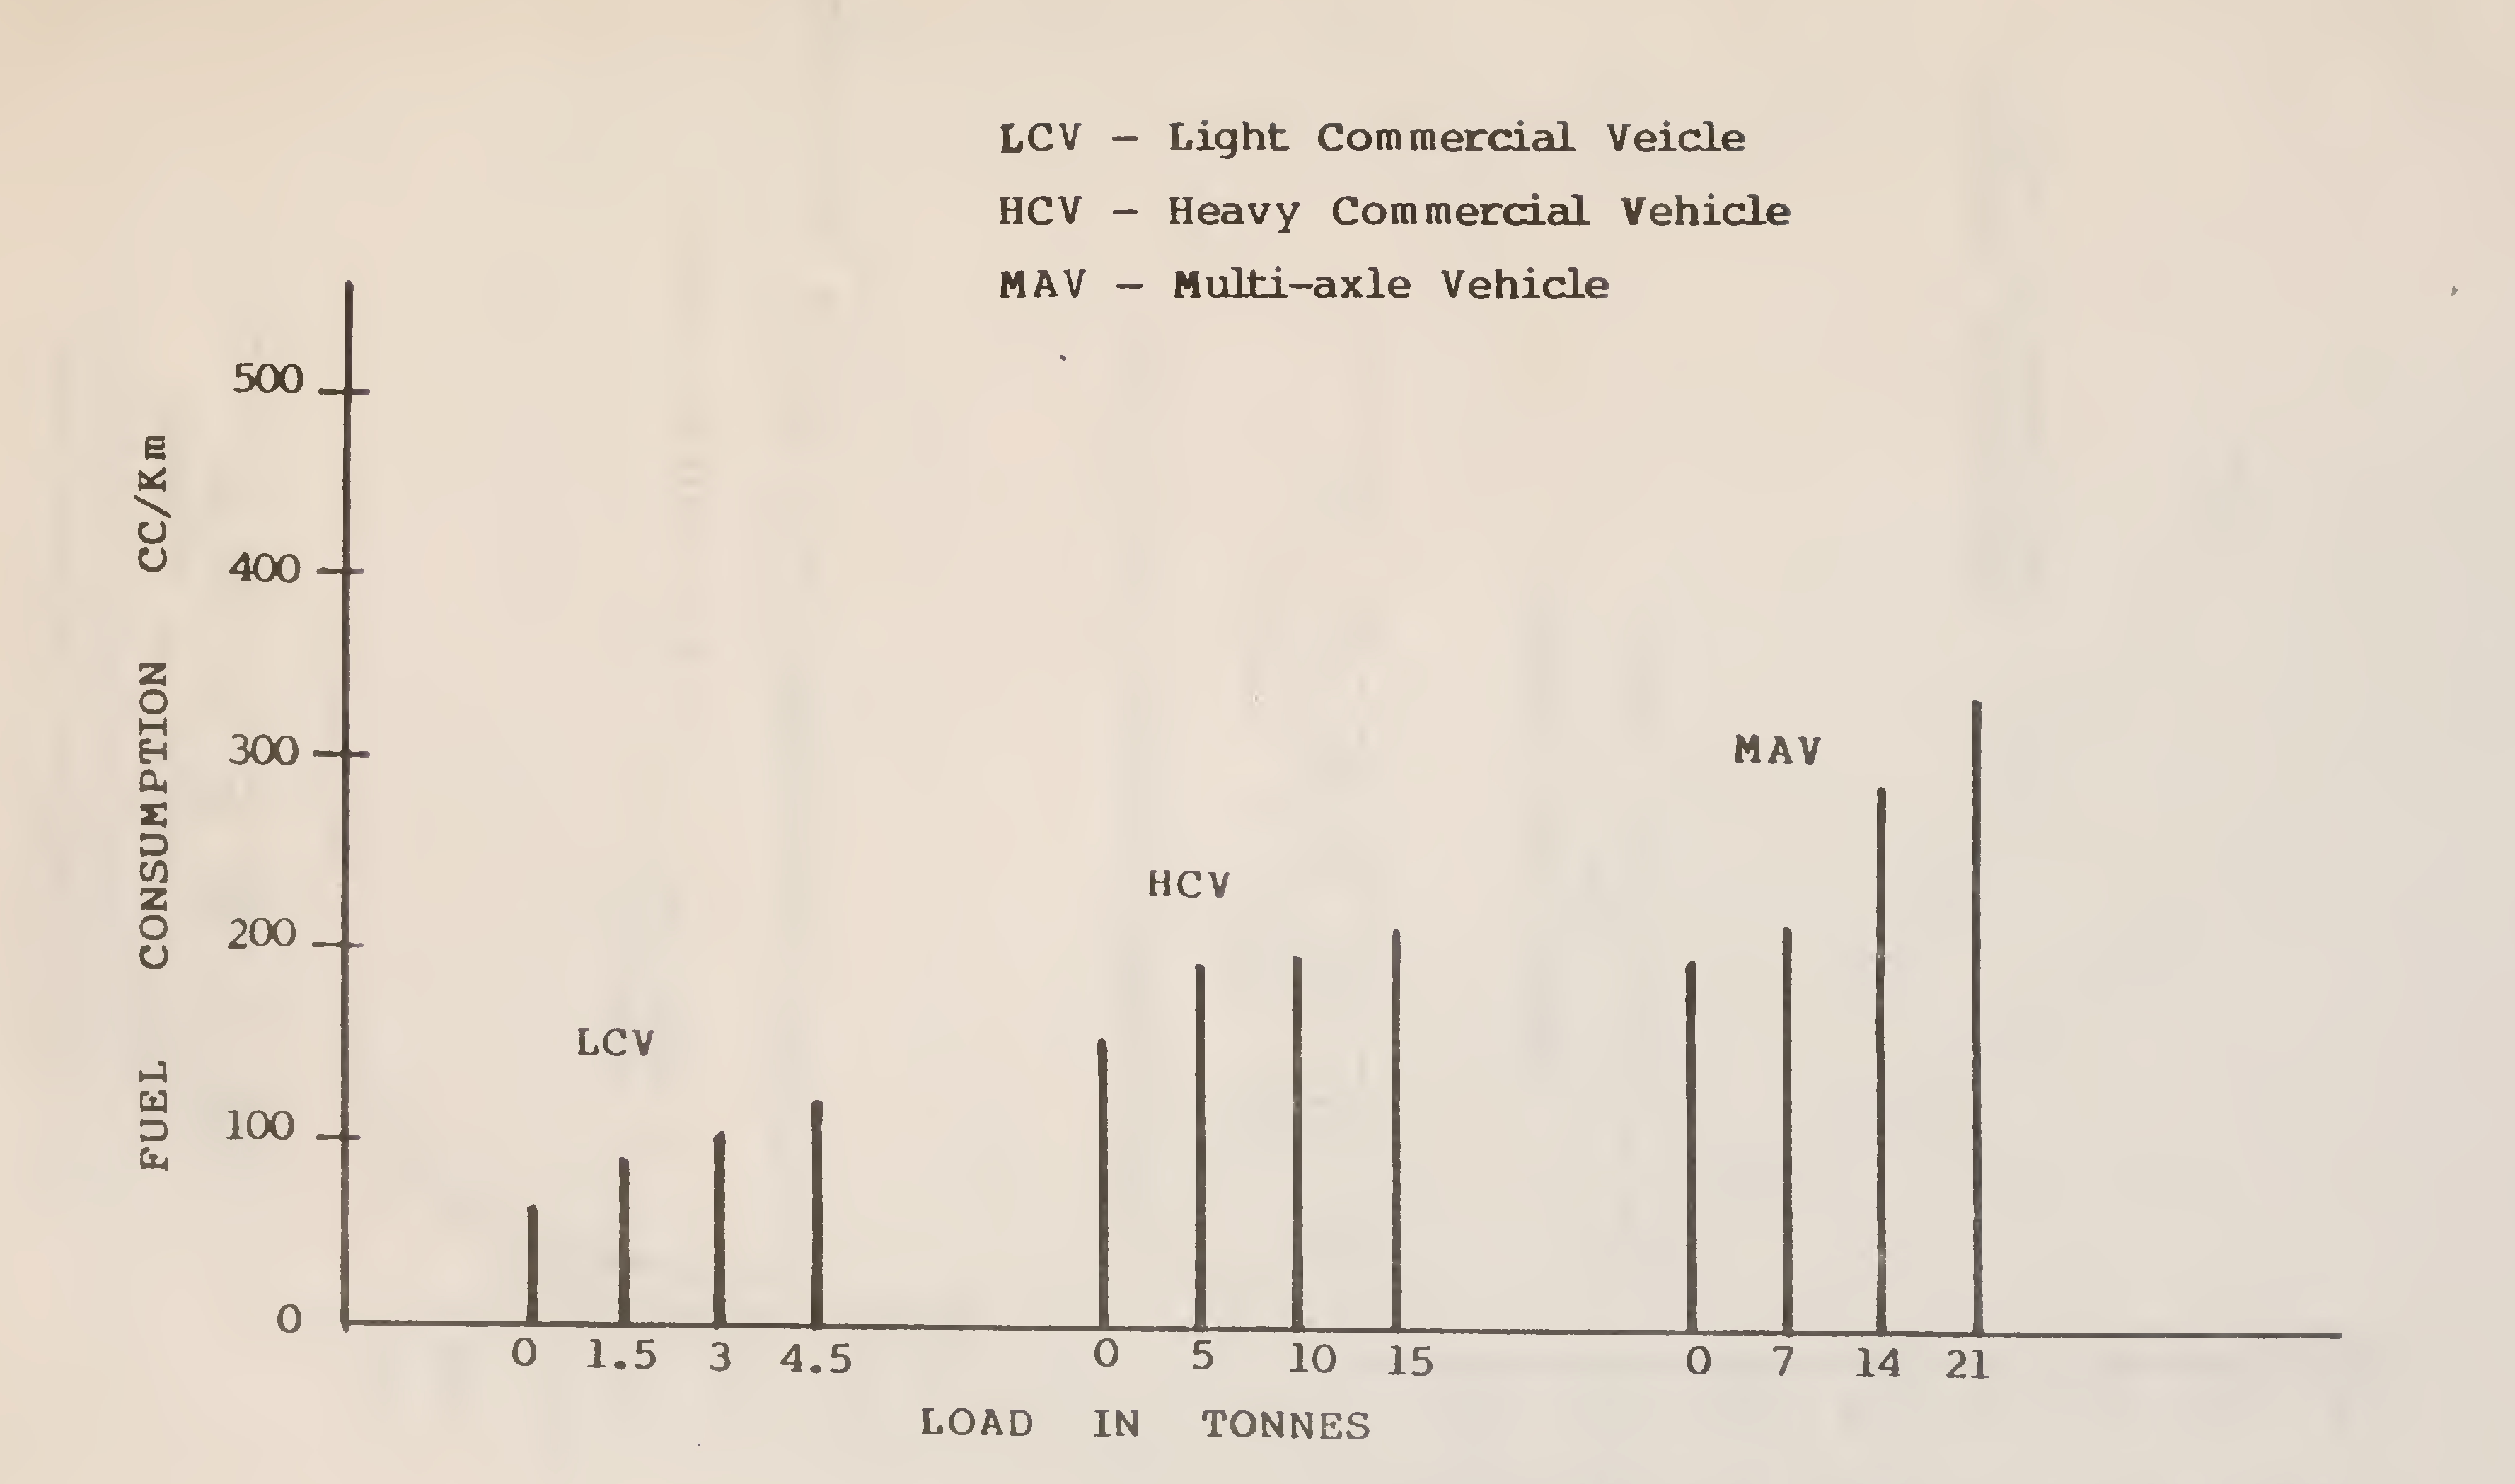
Fig. 19. Influence of load on fuel consumption of trucks29
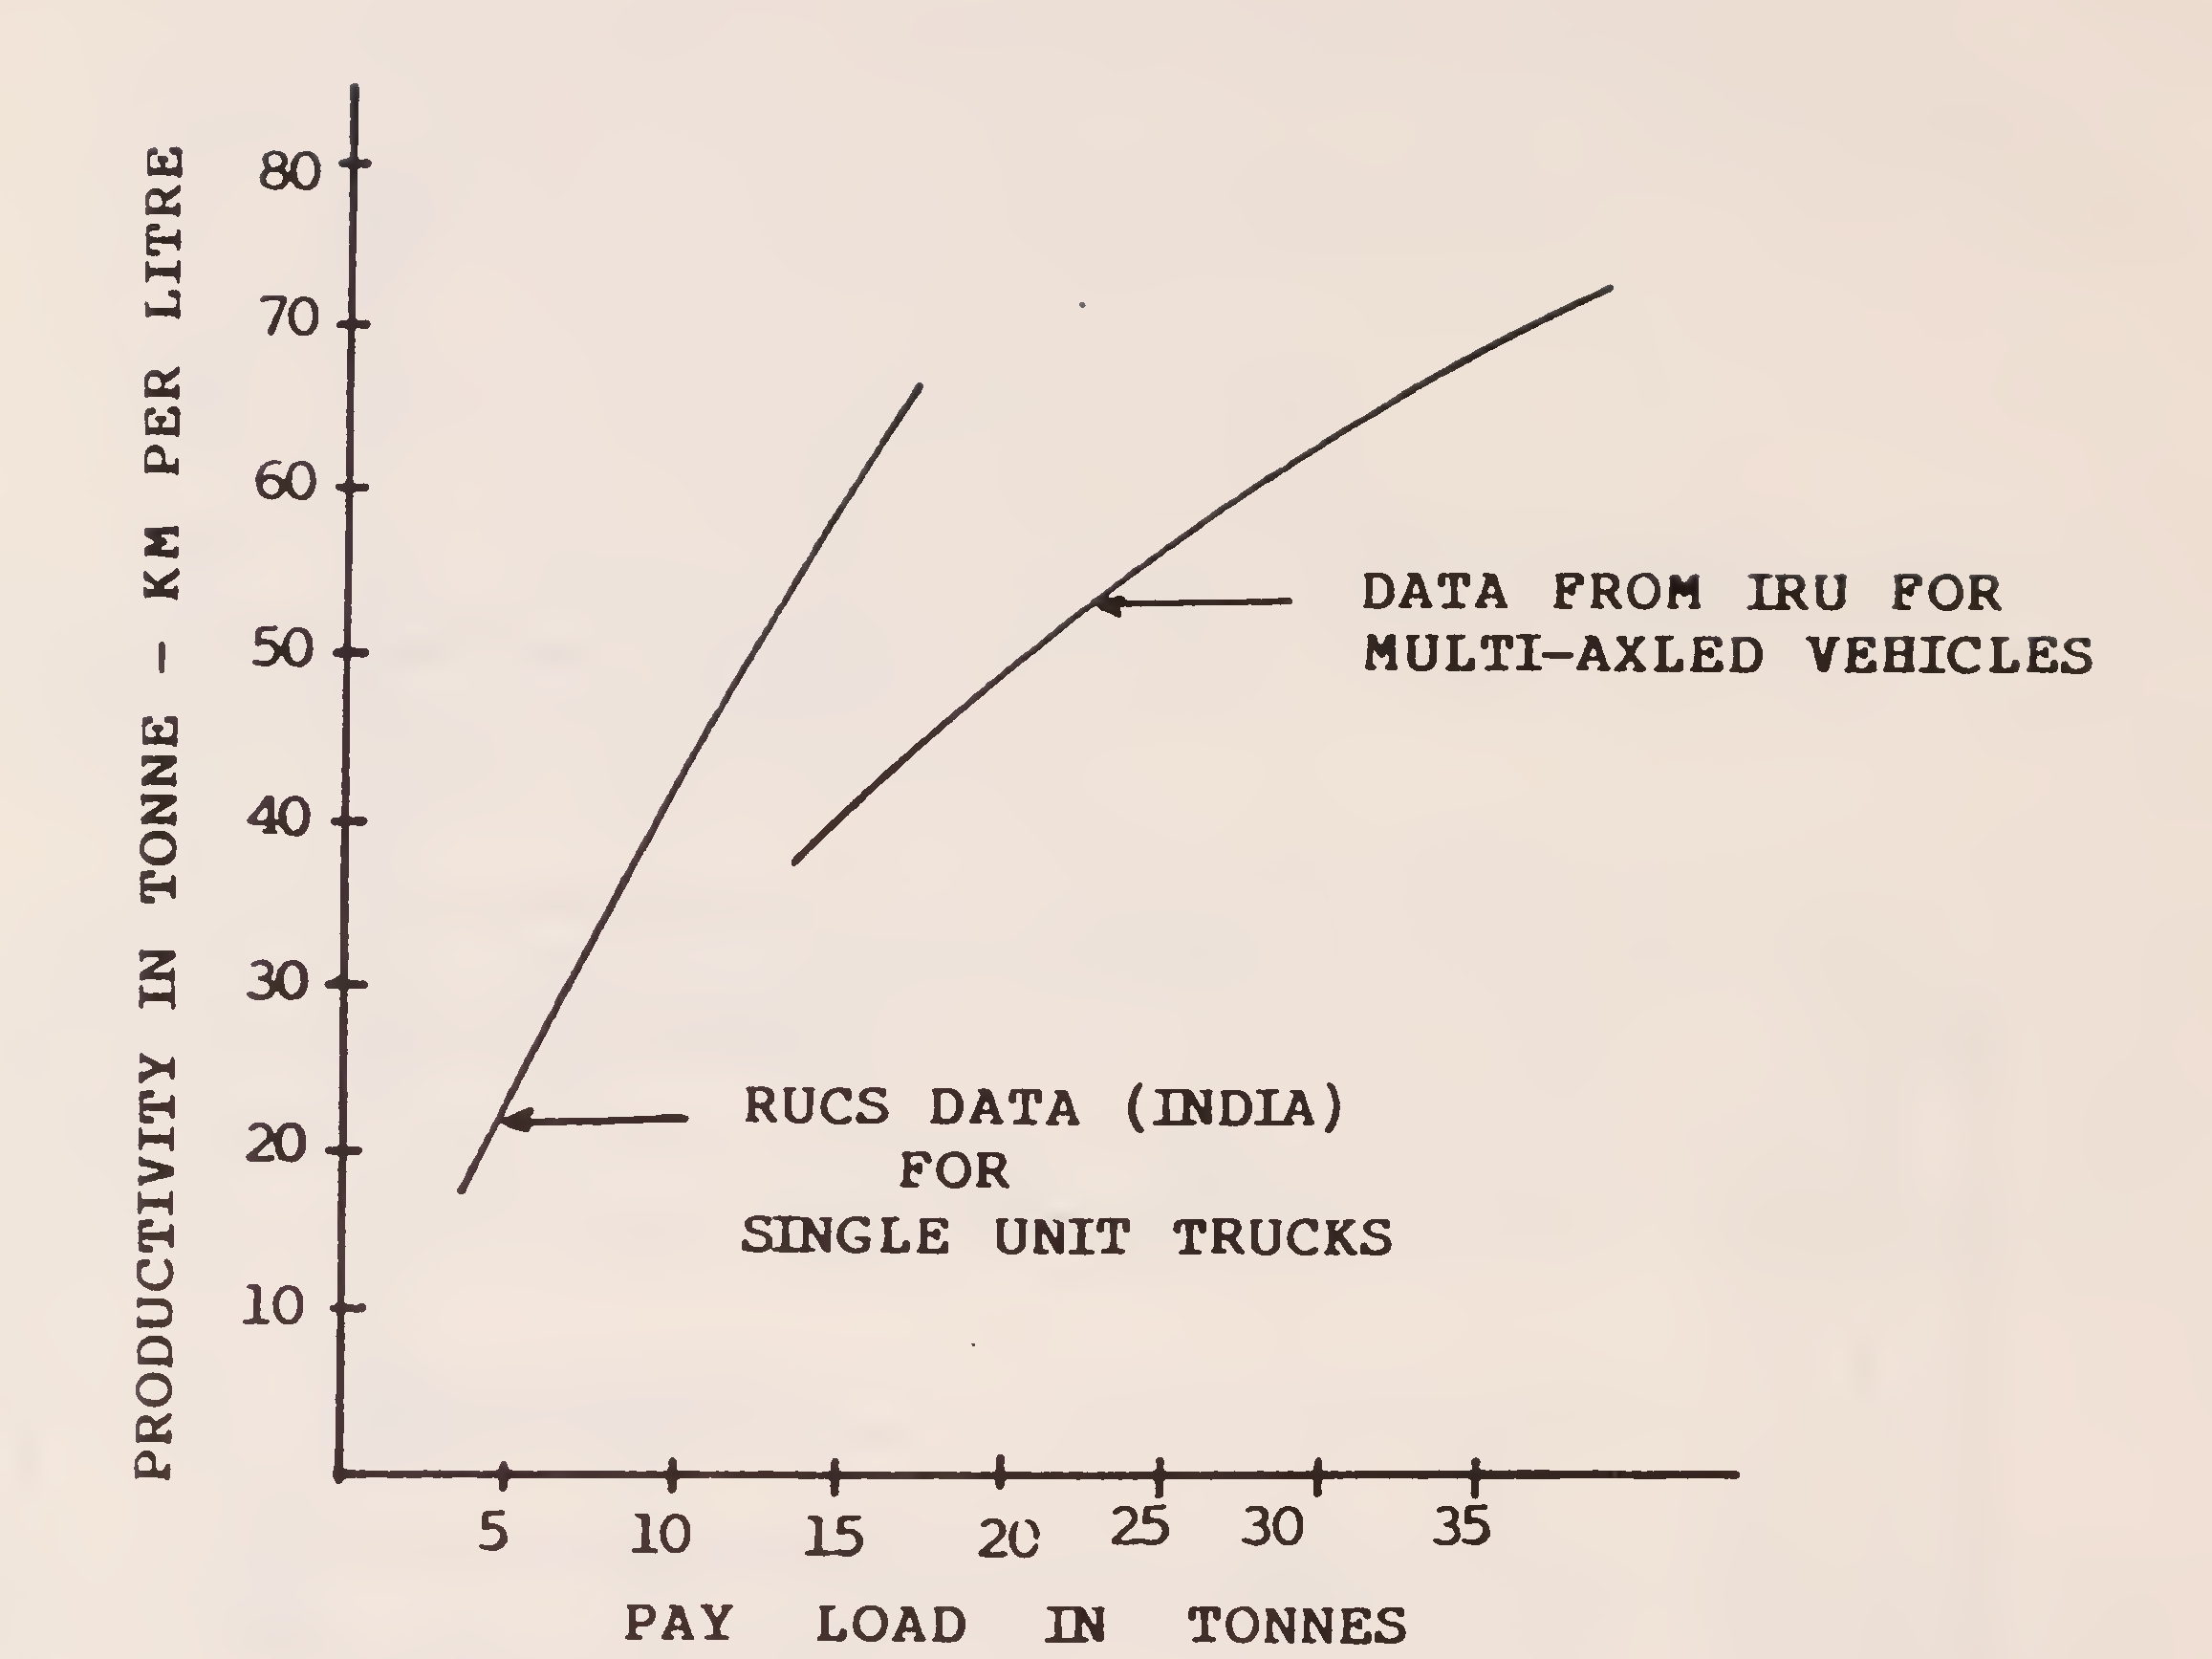
Fig. 20. Productivity of fuel for various pay-loads
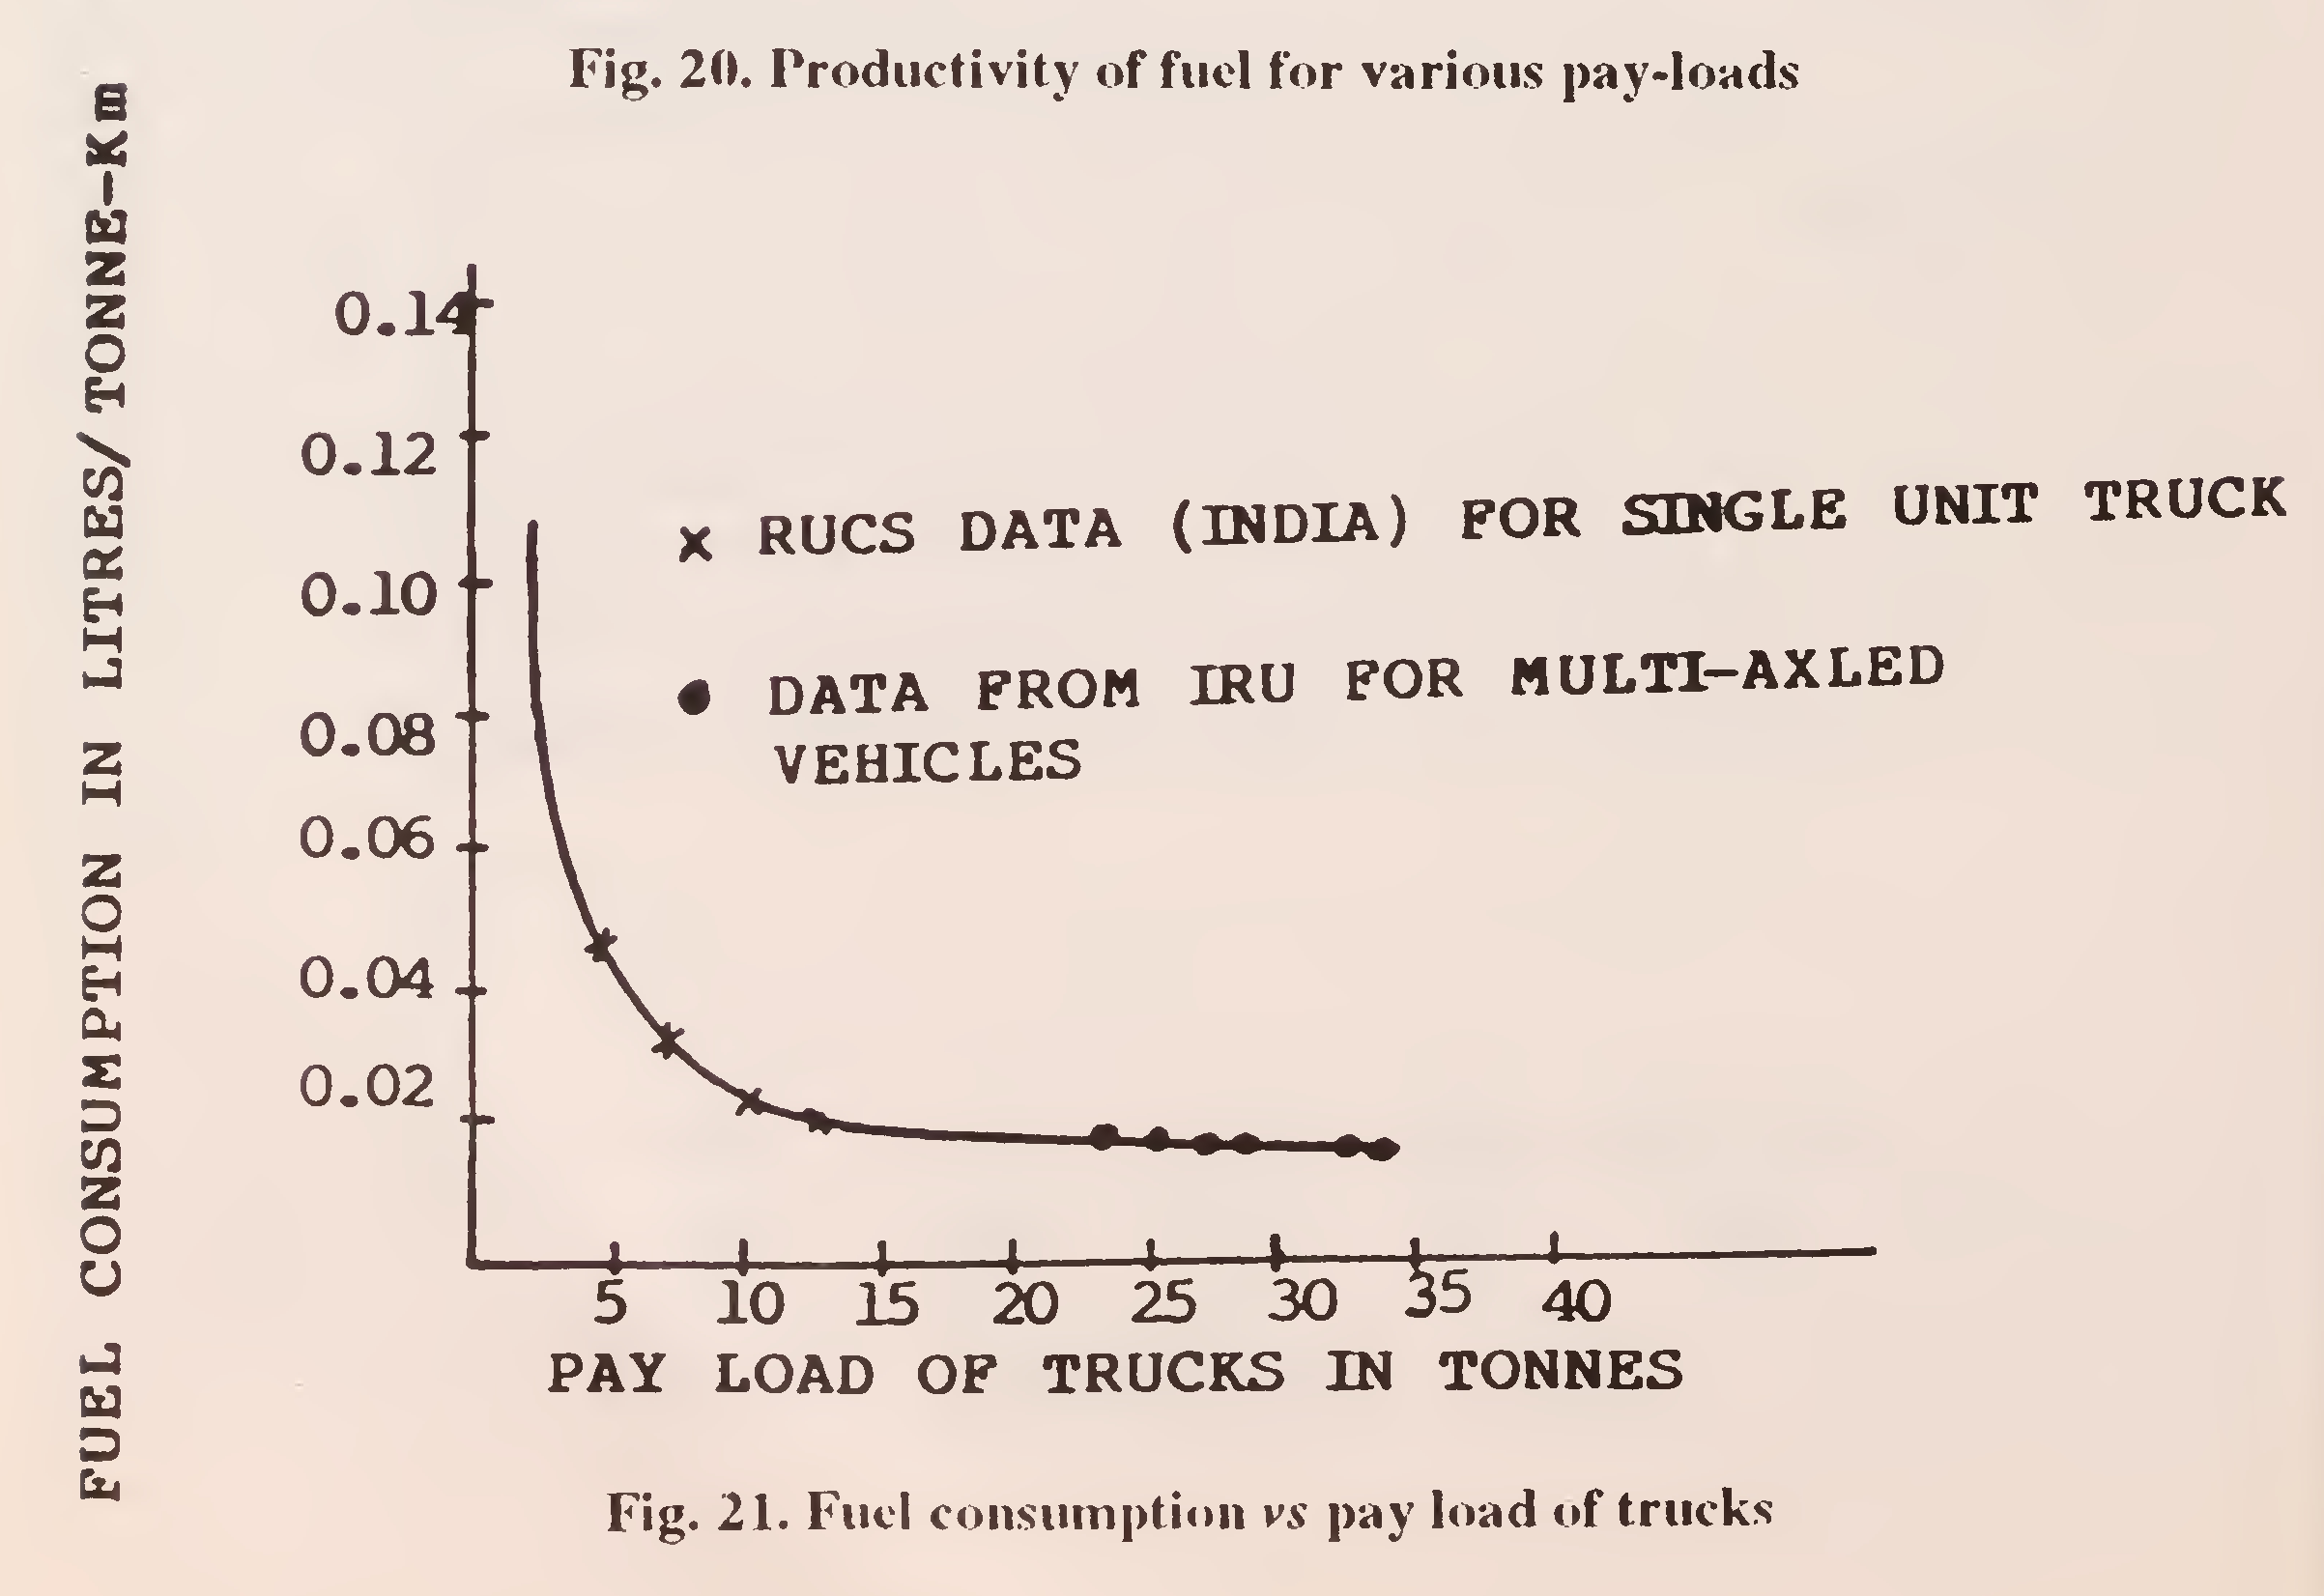
Fig. 21. Fuel consumption vs pay load of trucks30
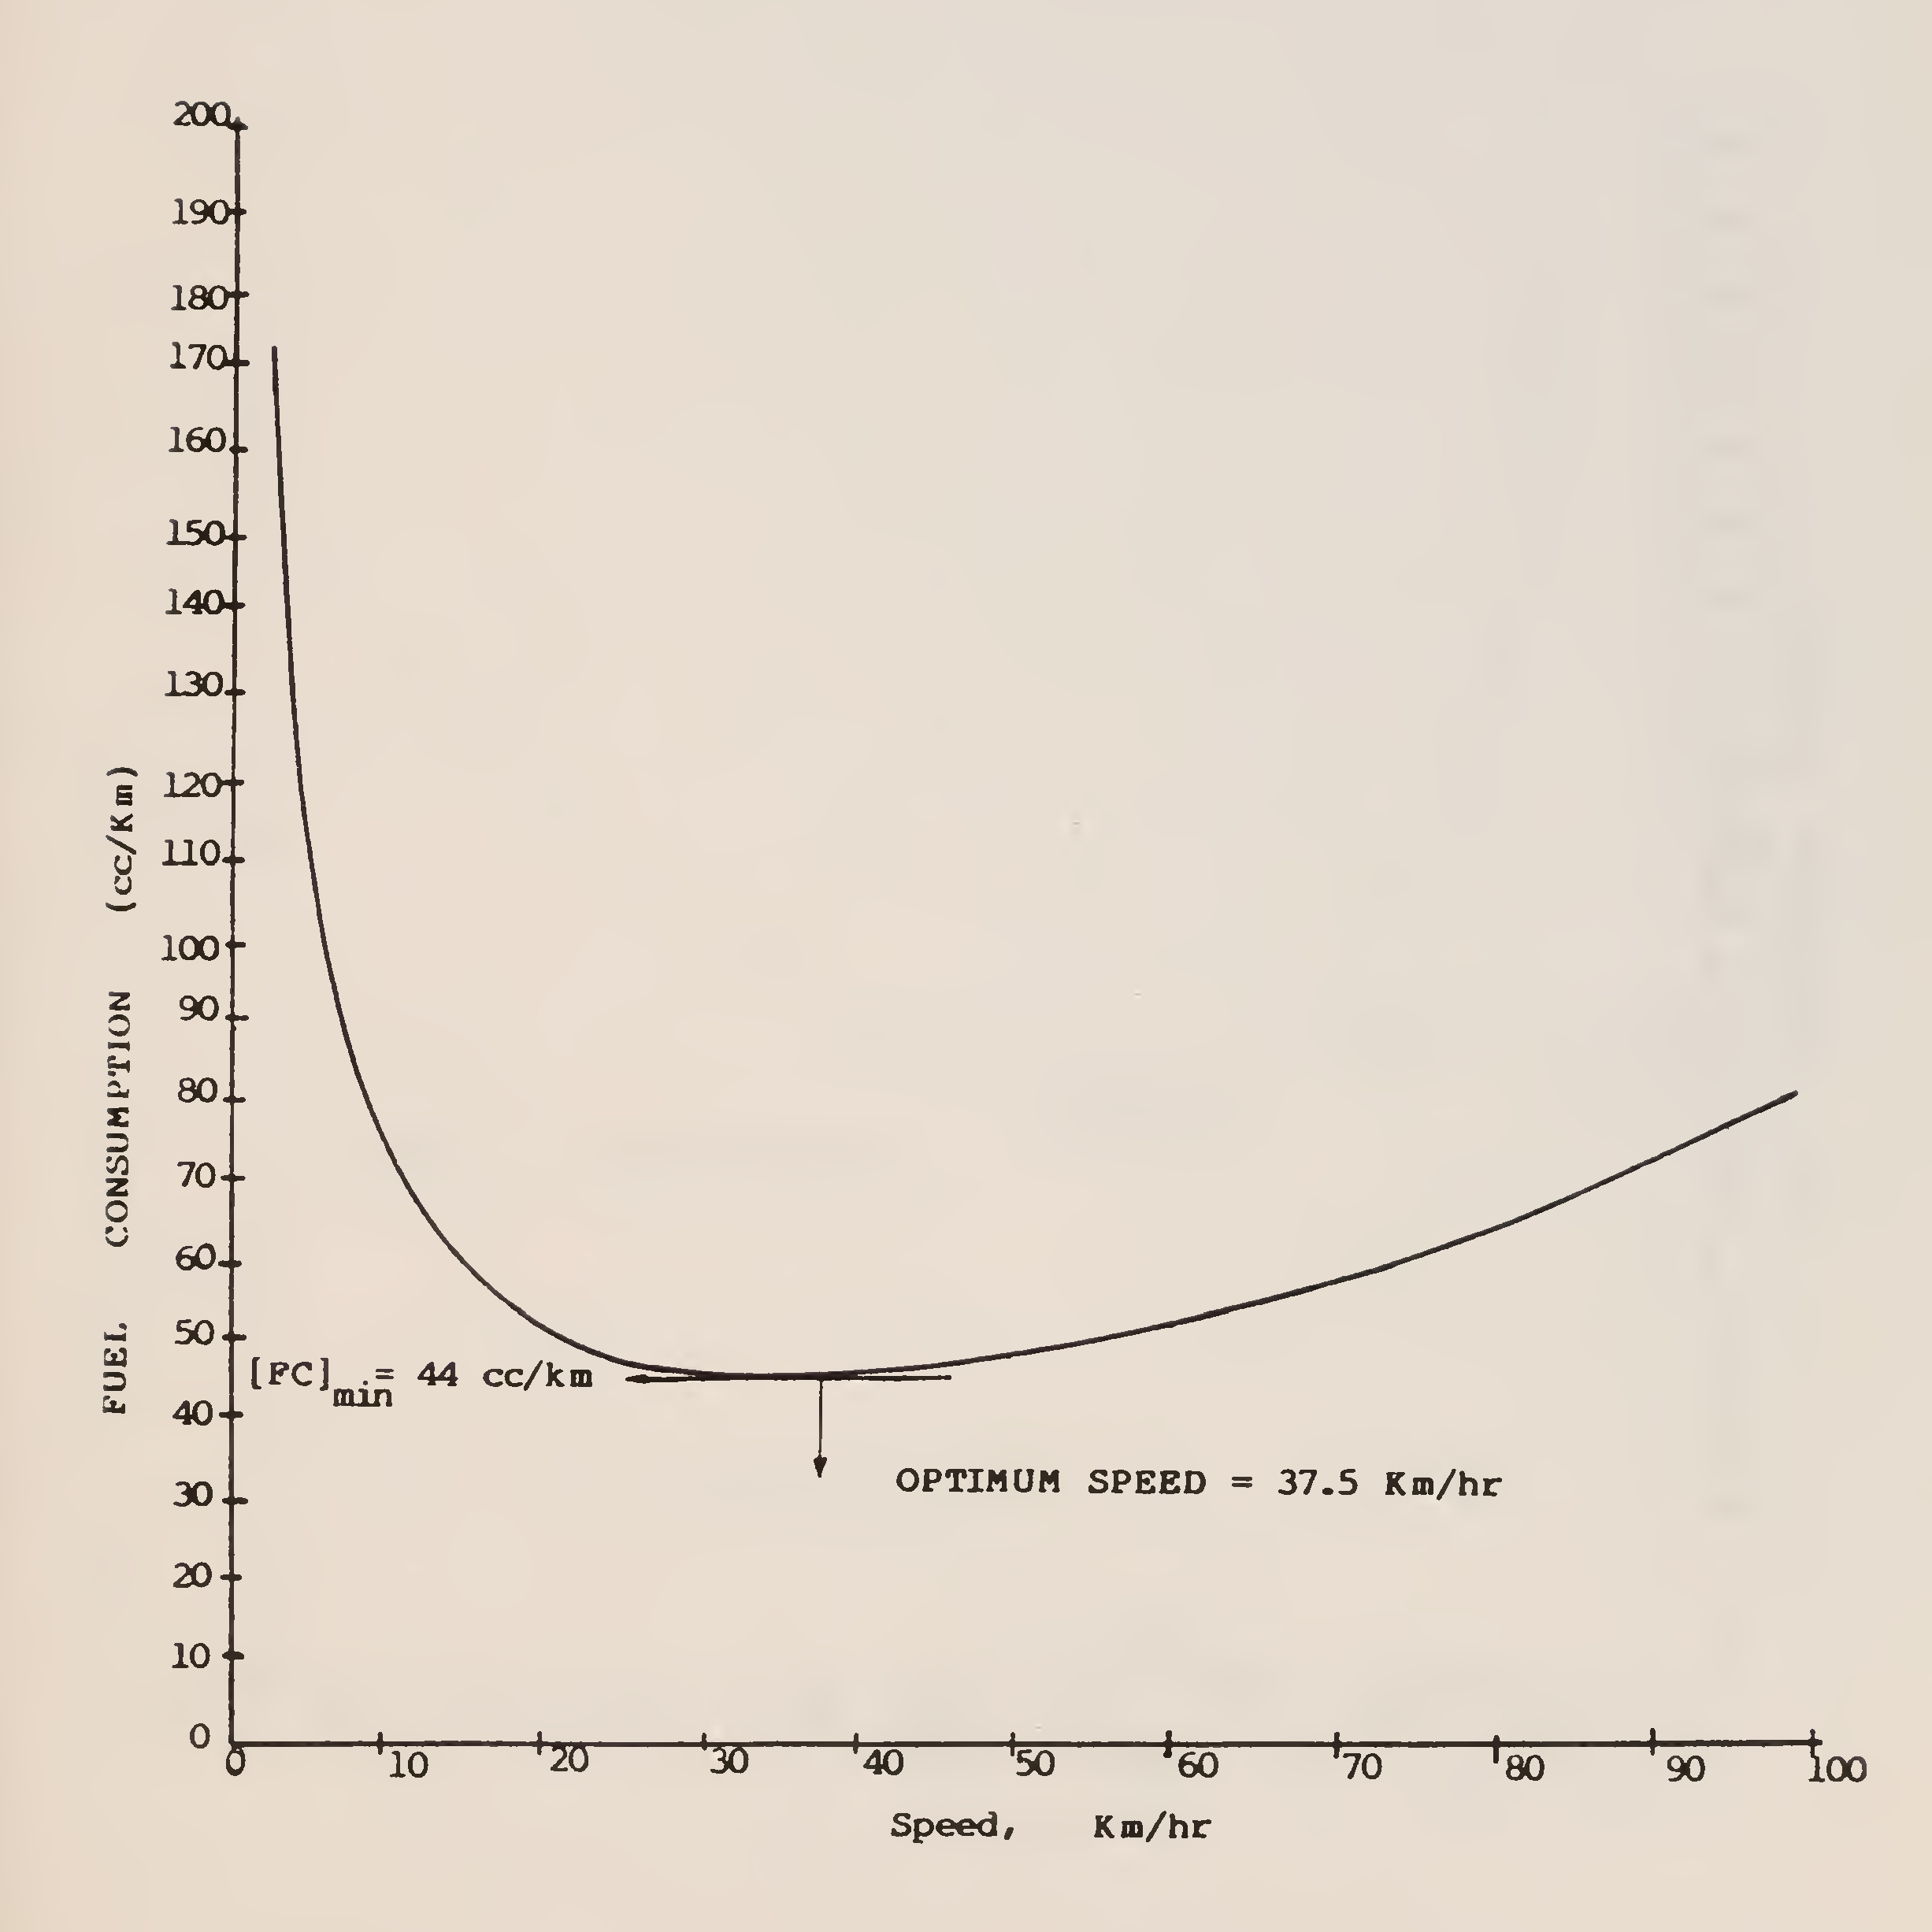
Fig. 22. Fuel consumption - speed plots for Maruti cars31
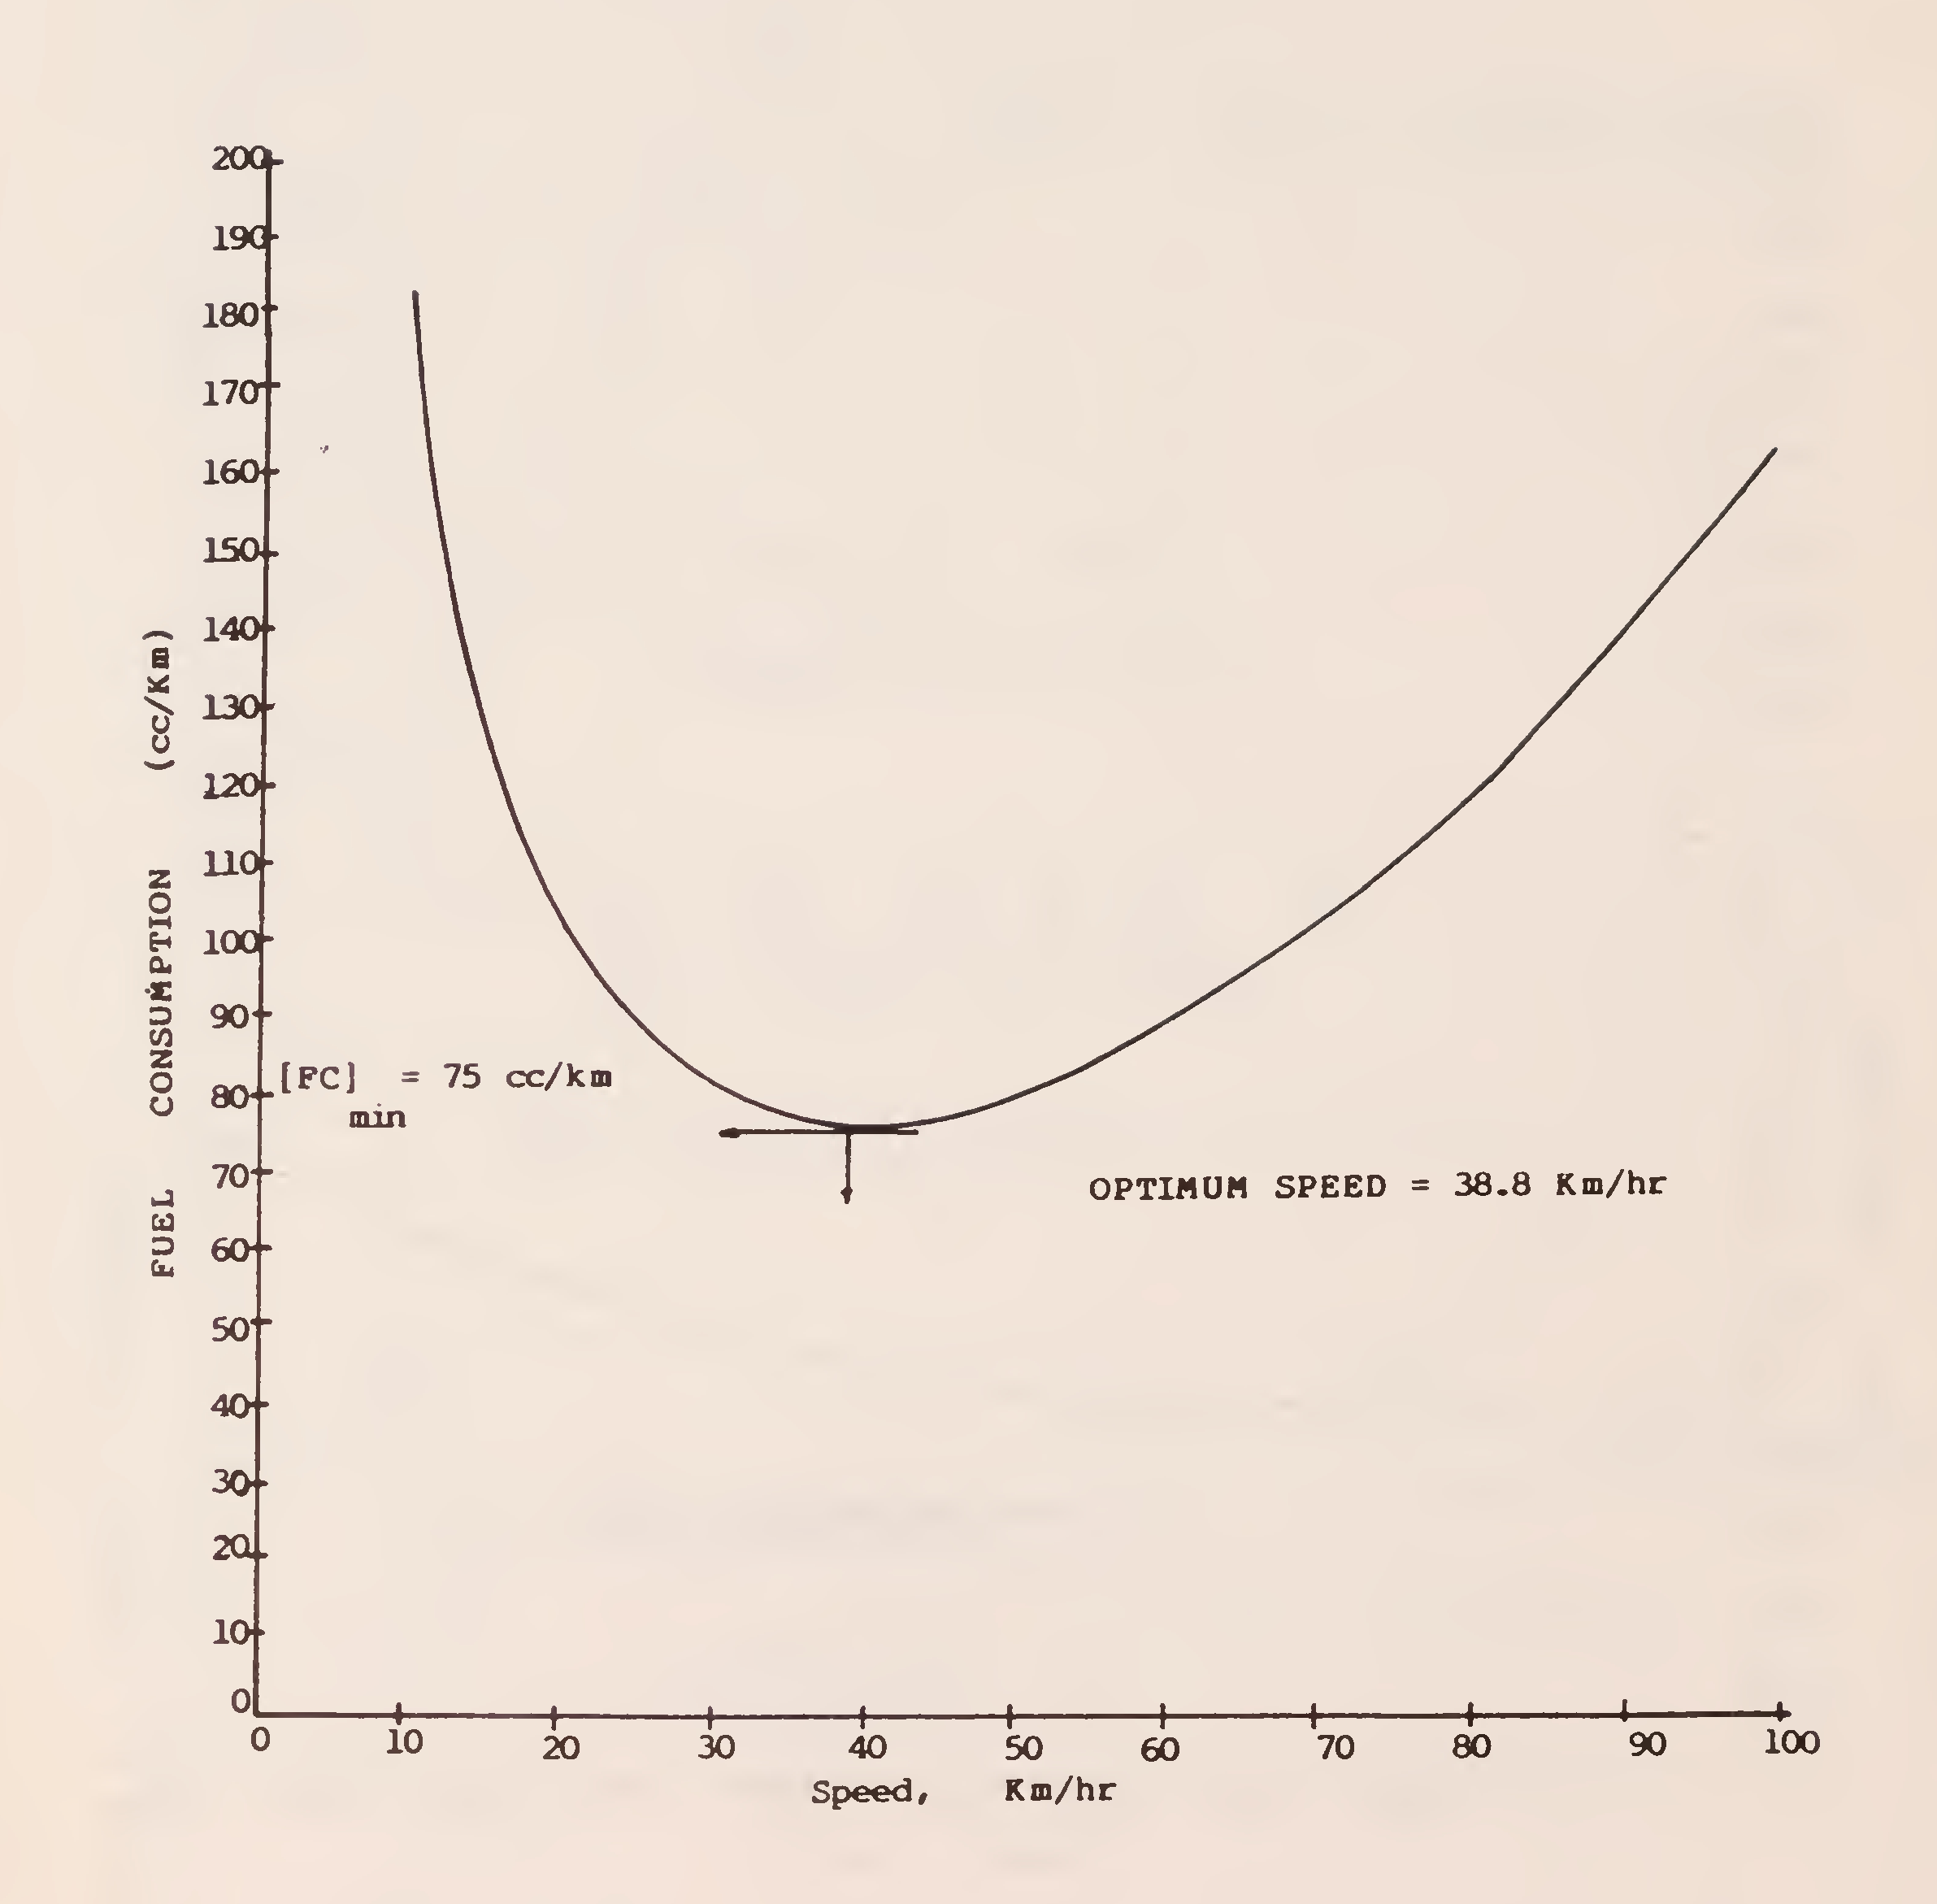
Fig. 23. Fuel consumption - speed plots for Ambassador cars32
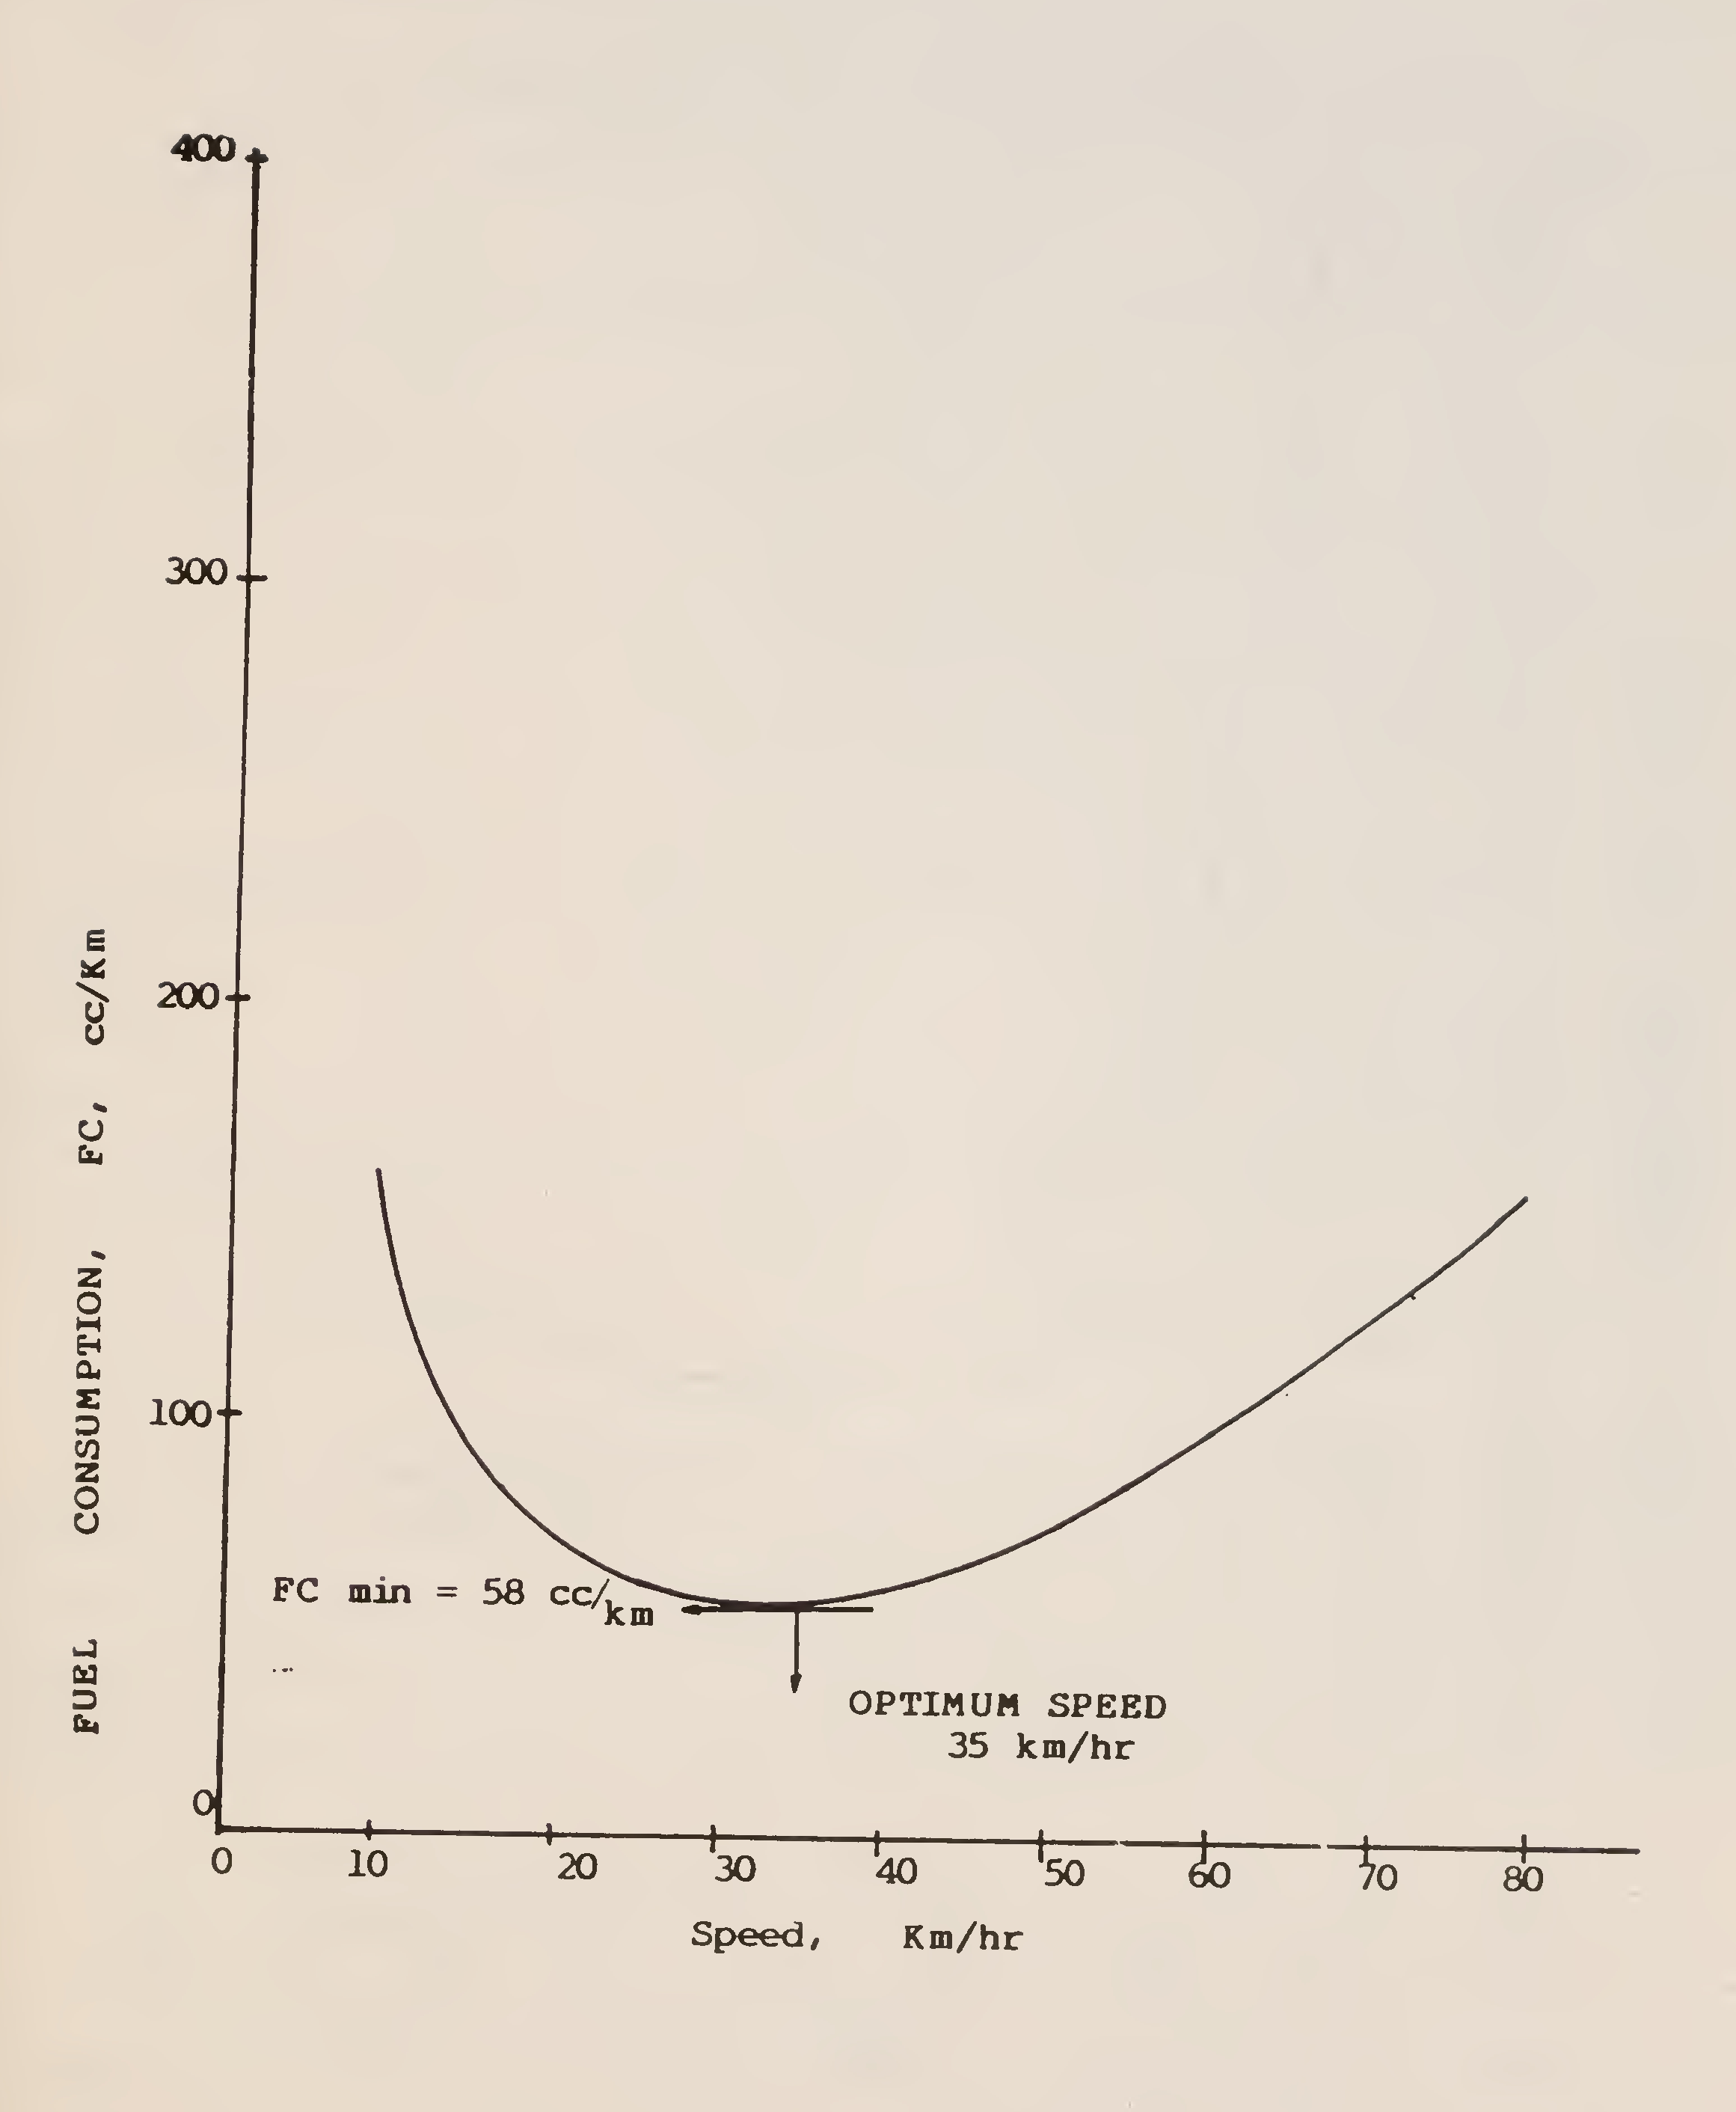
Fig. 24. Fuel consumption - speed plots for LCV on level smooth road33
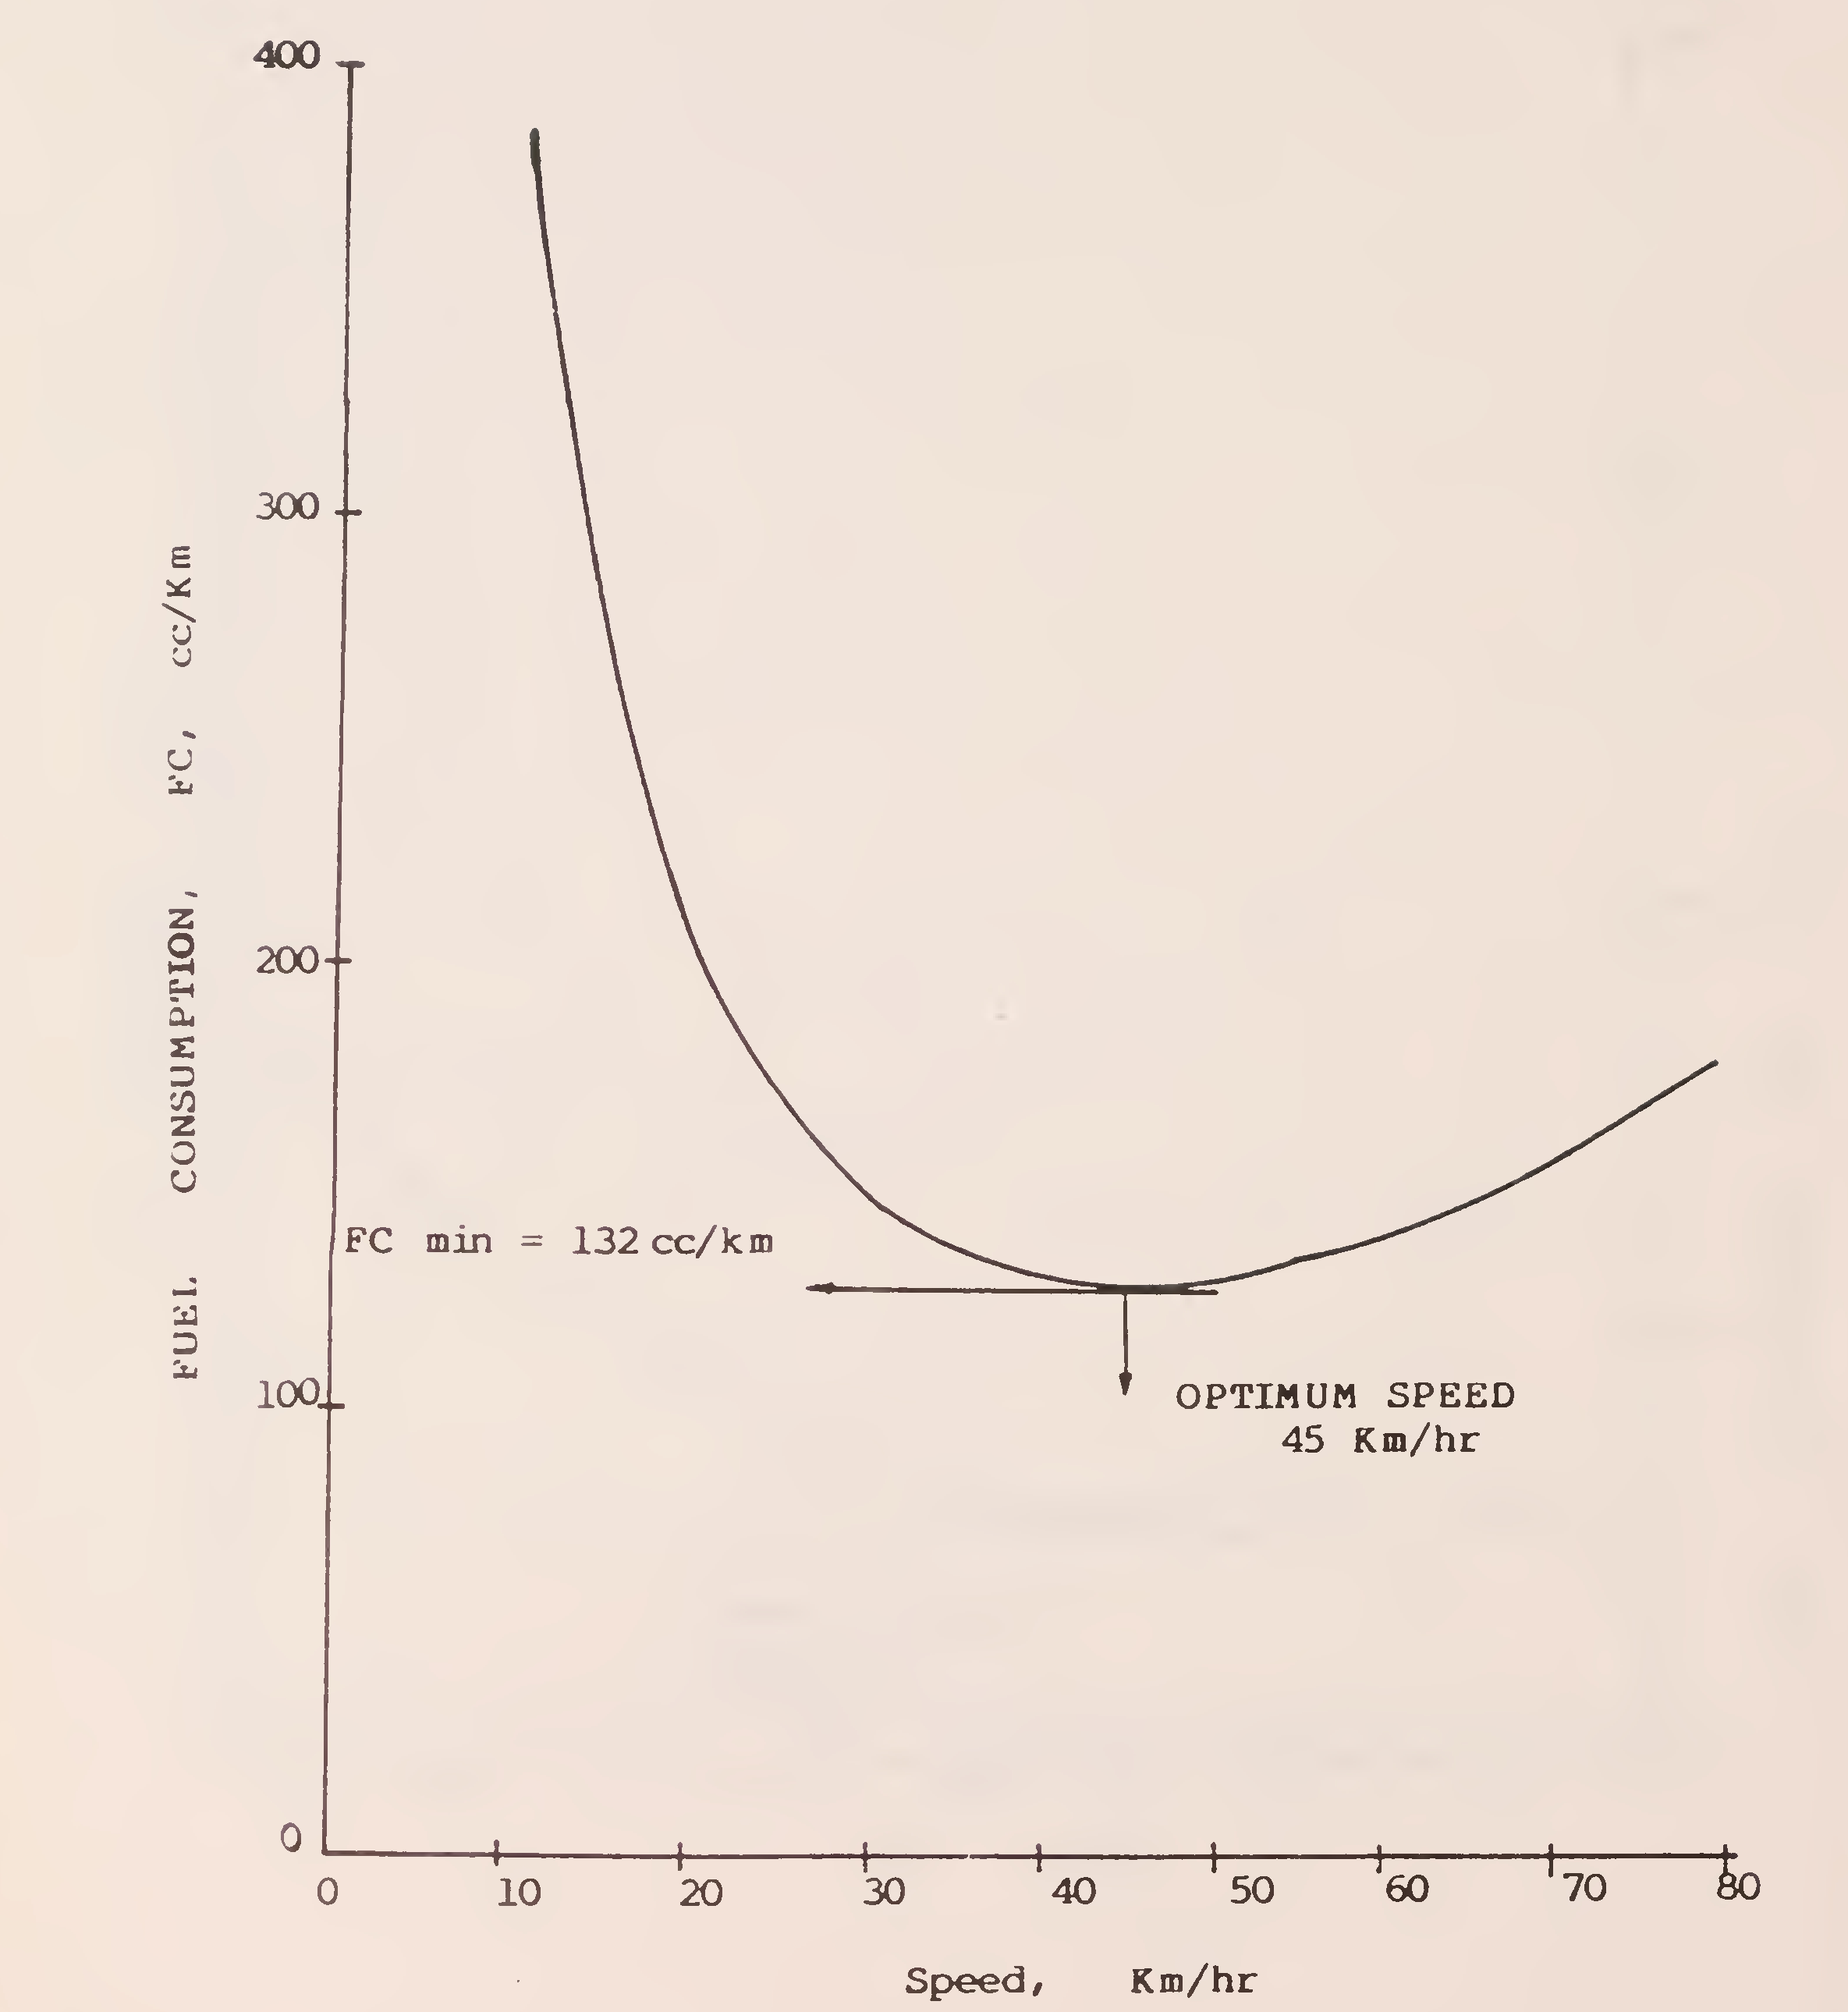
Fig. 25. Fuel consumption - speed plots for TATA truck on level smooth road34
pavements, segregating the slow moving traffic like animal drawn carts, bycycles etc., and remove hawkers, vendors from road side. Fig. 26 gives the savings possible by widening road pavements.
| Vehicle | Optimum Speed (kmph) |
Fuel Consumption (cc/veh-km) |
|---|---|---|
| Ambassador Car | 38.8 | 75.0 * |
| Premier Padmini Car | 40.0 | 71.02 * |
| Maruti | 37.5 | 44.00 * |
| Diesel Jeep | 35.0 | 69.6 * |
| Tata Truck | 45.0 | 132.0 * |
| Ashok Leyland Beaver Truck | 35.0 | 305.72 * |
| Light Commercial Vehicle | 35.0 | 58.0 * |
| Urban Bus | - | 247.1 |
| Regional Bus | - | 225.36 |
| *From Ref (3) | ||
Vehicles negotiating upward grades have to overcome the forces of gravity, causing extra energy consumption. On the other hand, when vehicles travel downgrade, fuel is saved. The pattern of excess fuel consumption on upward gradients is shown in Fig. 27 for a typical car and a truck. This factor should be borne in mind when designing the vertical profile of new roads.
When vehicles are forced to stop and engines are idling, fuel is burnt without any productive effort. Forced stops arc found at traffic junctions and check barriers. Delays at junctions can be minimised by optimum design of signal settings and coordinated signals. Check barriers should be avoided or their number reduced. Octroi posts are a source of considerable wastage of fuels. Educating the drivers to shut off the engine can save fuel.35
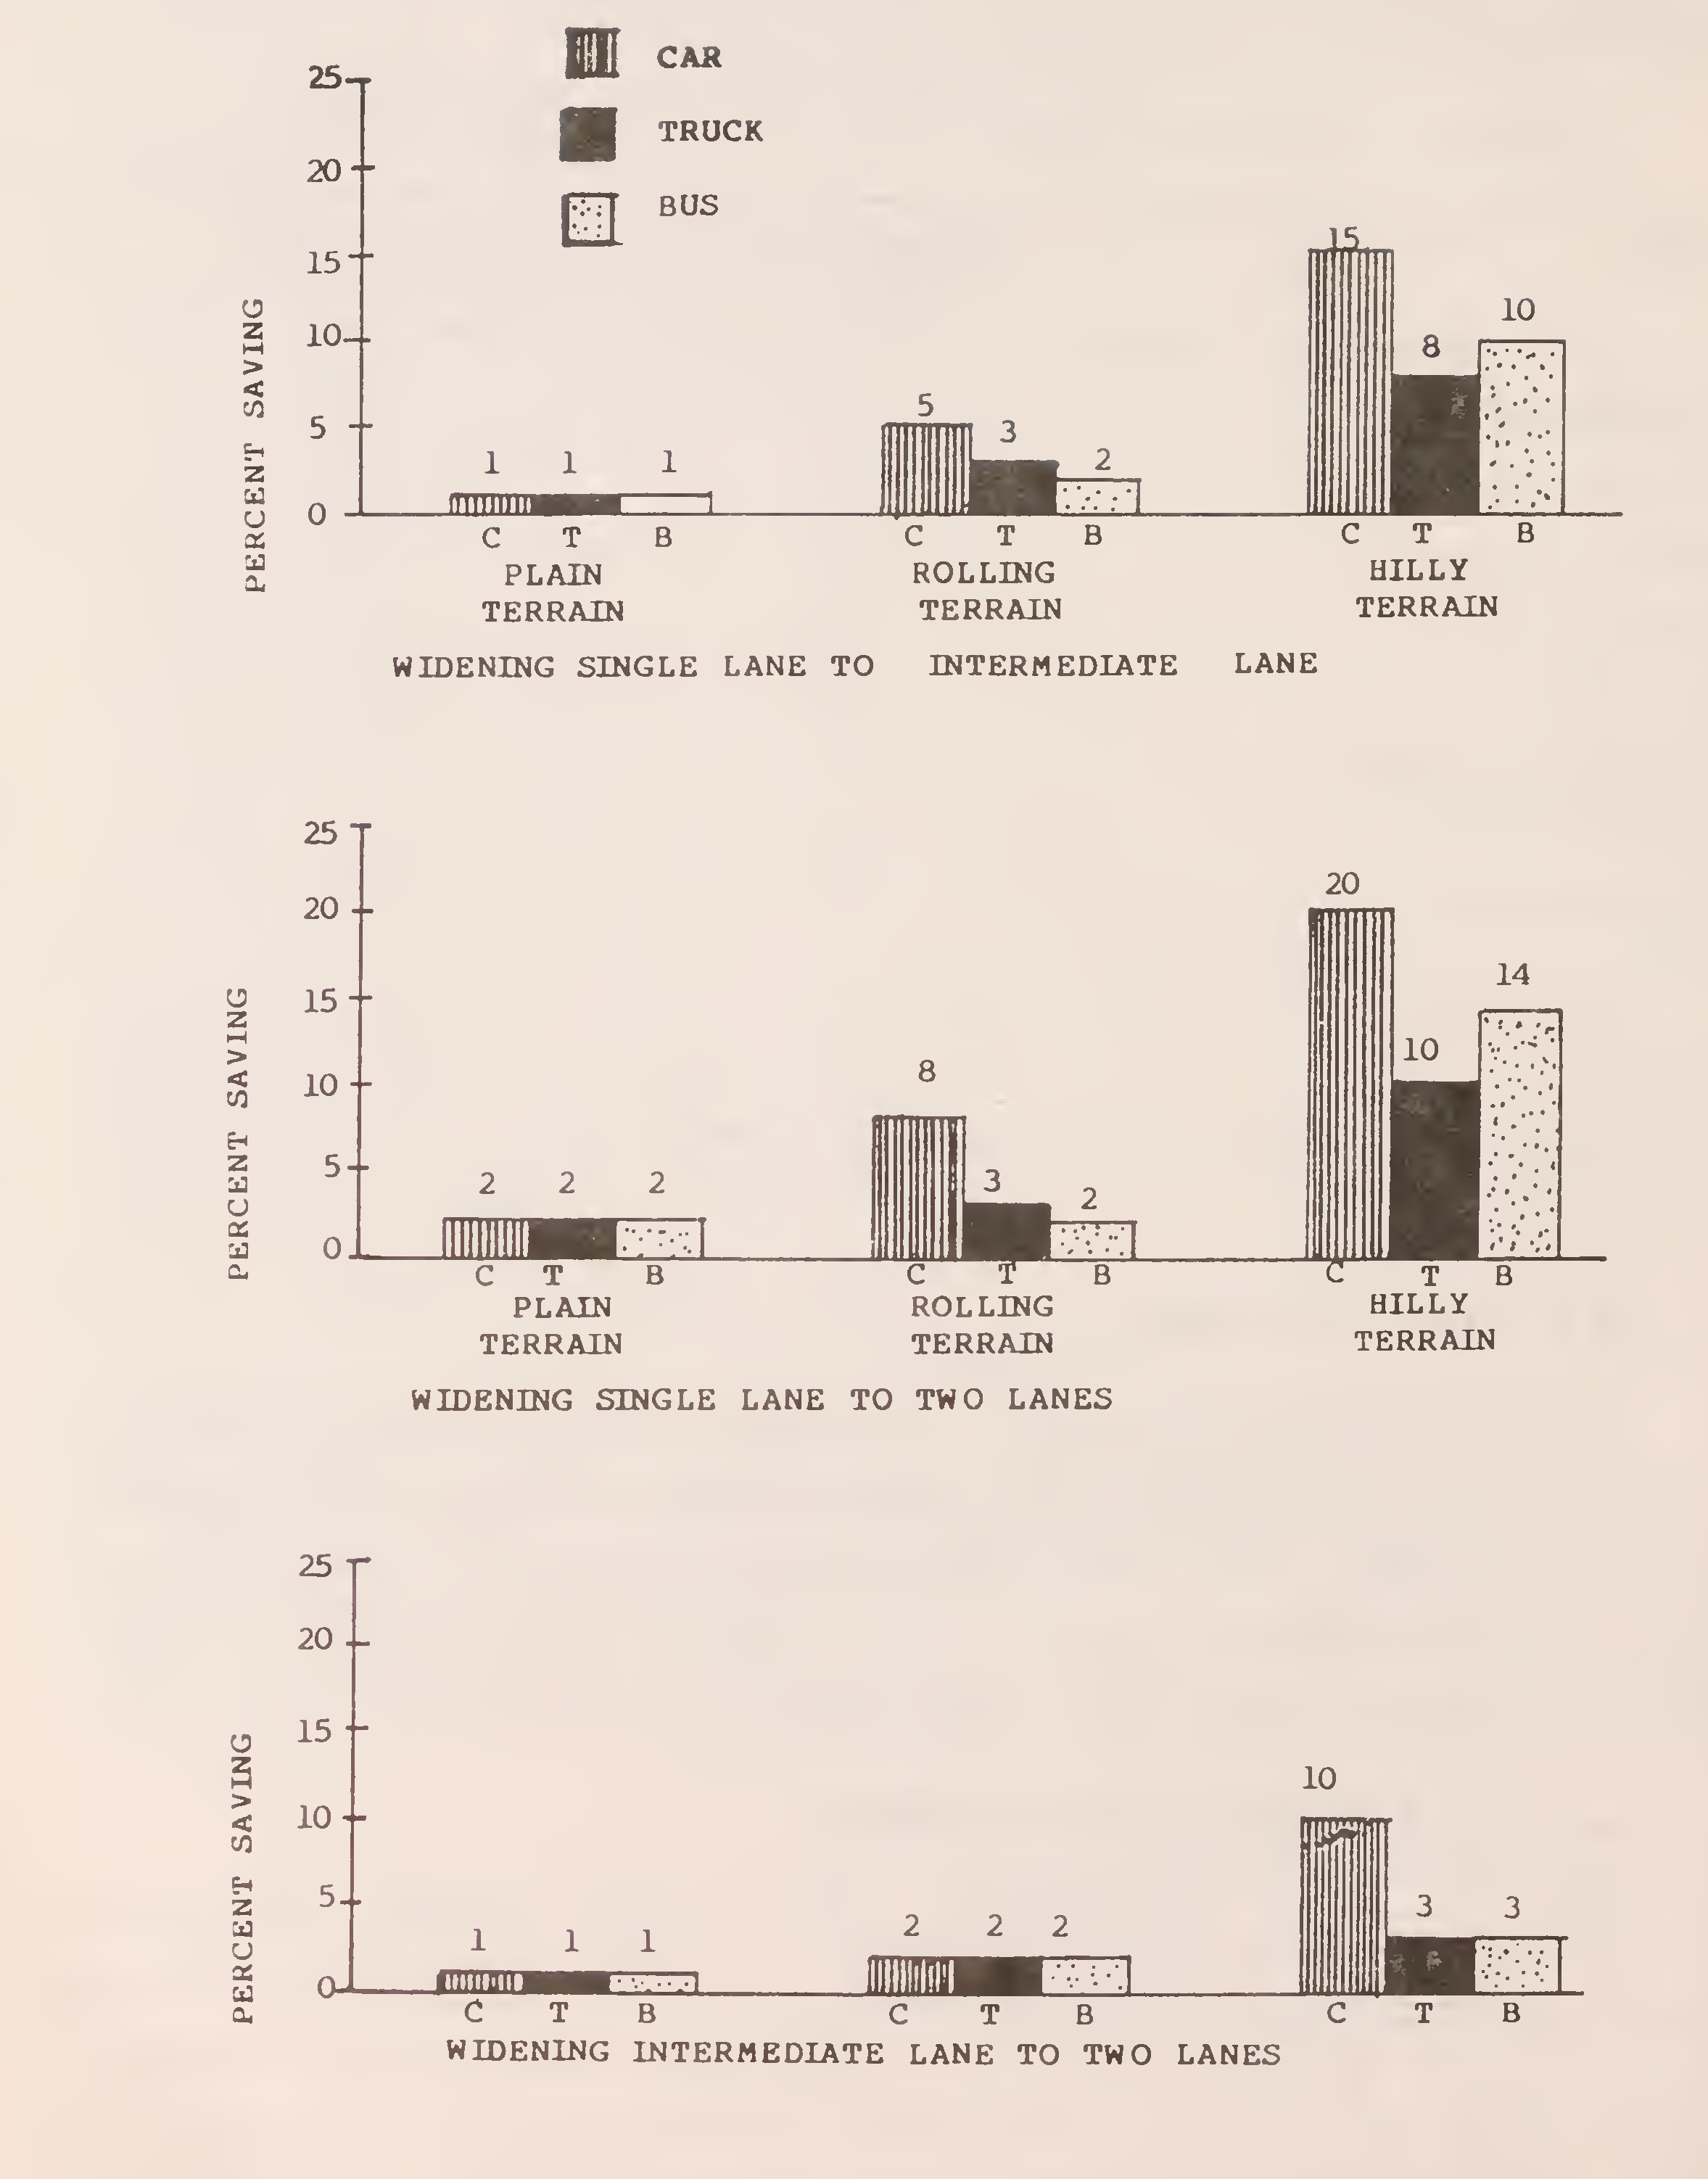
Fig. 26. Saving in fuel due to pavement widening36
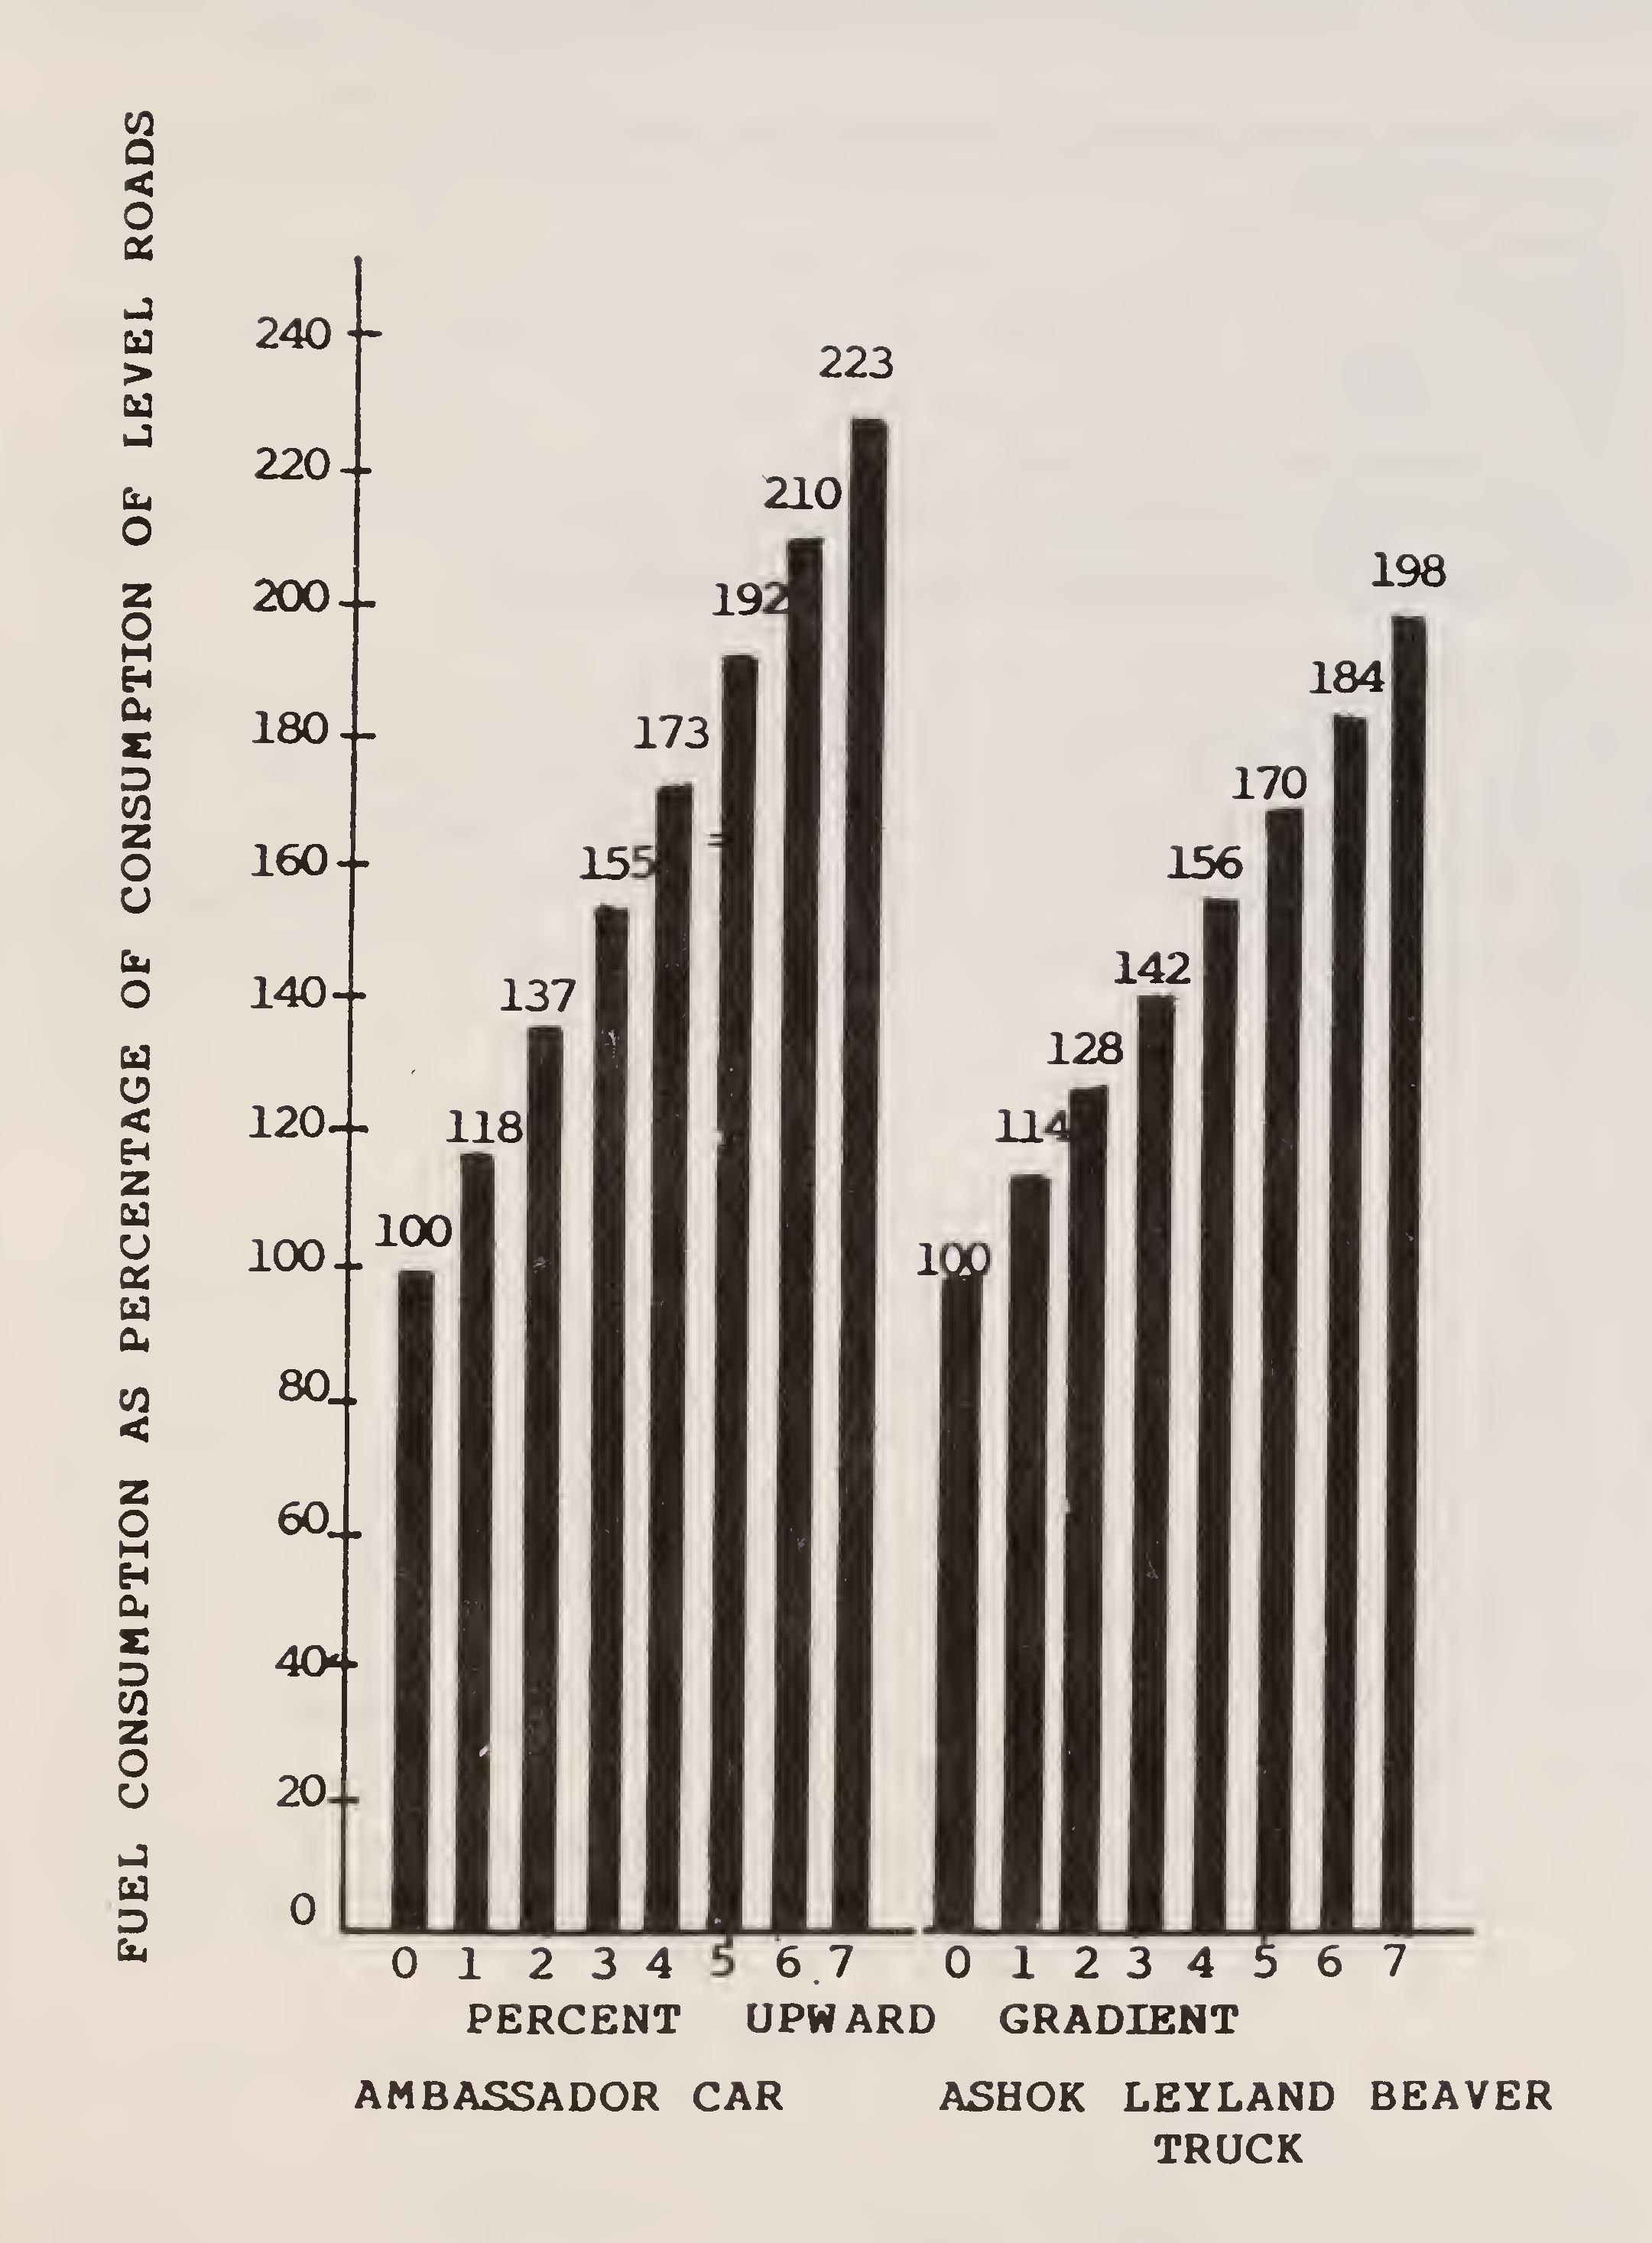
Fig. 27. Fuel consumption of vehicles on upward gradients37
The idle fuel consumption of some typical vehicles are given in Table 5.
| S.No. | Vehicle | Idle Fuel Consumption (cc per min) |
|---|---|---|
| 1. | Ambassador Car | 13.0 |
| 2. | Premier Padmini Car | 10.5 |
| 3. | Maruti Car | 9.6 |
| 4. | Mahindra Jeep | 12.3 |
| 5. | Tata 10 T truck | 15.3 |
| 6. | Ashok Leyland heavy duty truck | 35.4 |
As the traffic on a road increases, the vehicles experience congestion. Whereas they are able to follow steady state speed conditions under low volumes, they have to perform frequent changes of speeds under congested conditons. Under extremely congested situations, stop and go motions take place. Consequently, loss of fuel takes place as shown in Fig.28. Recent
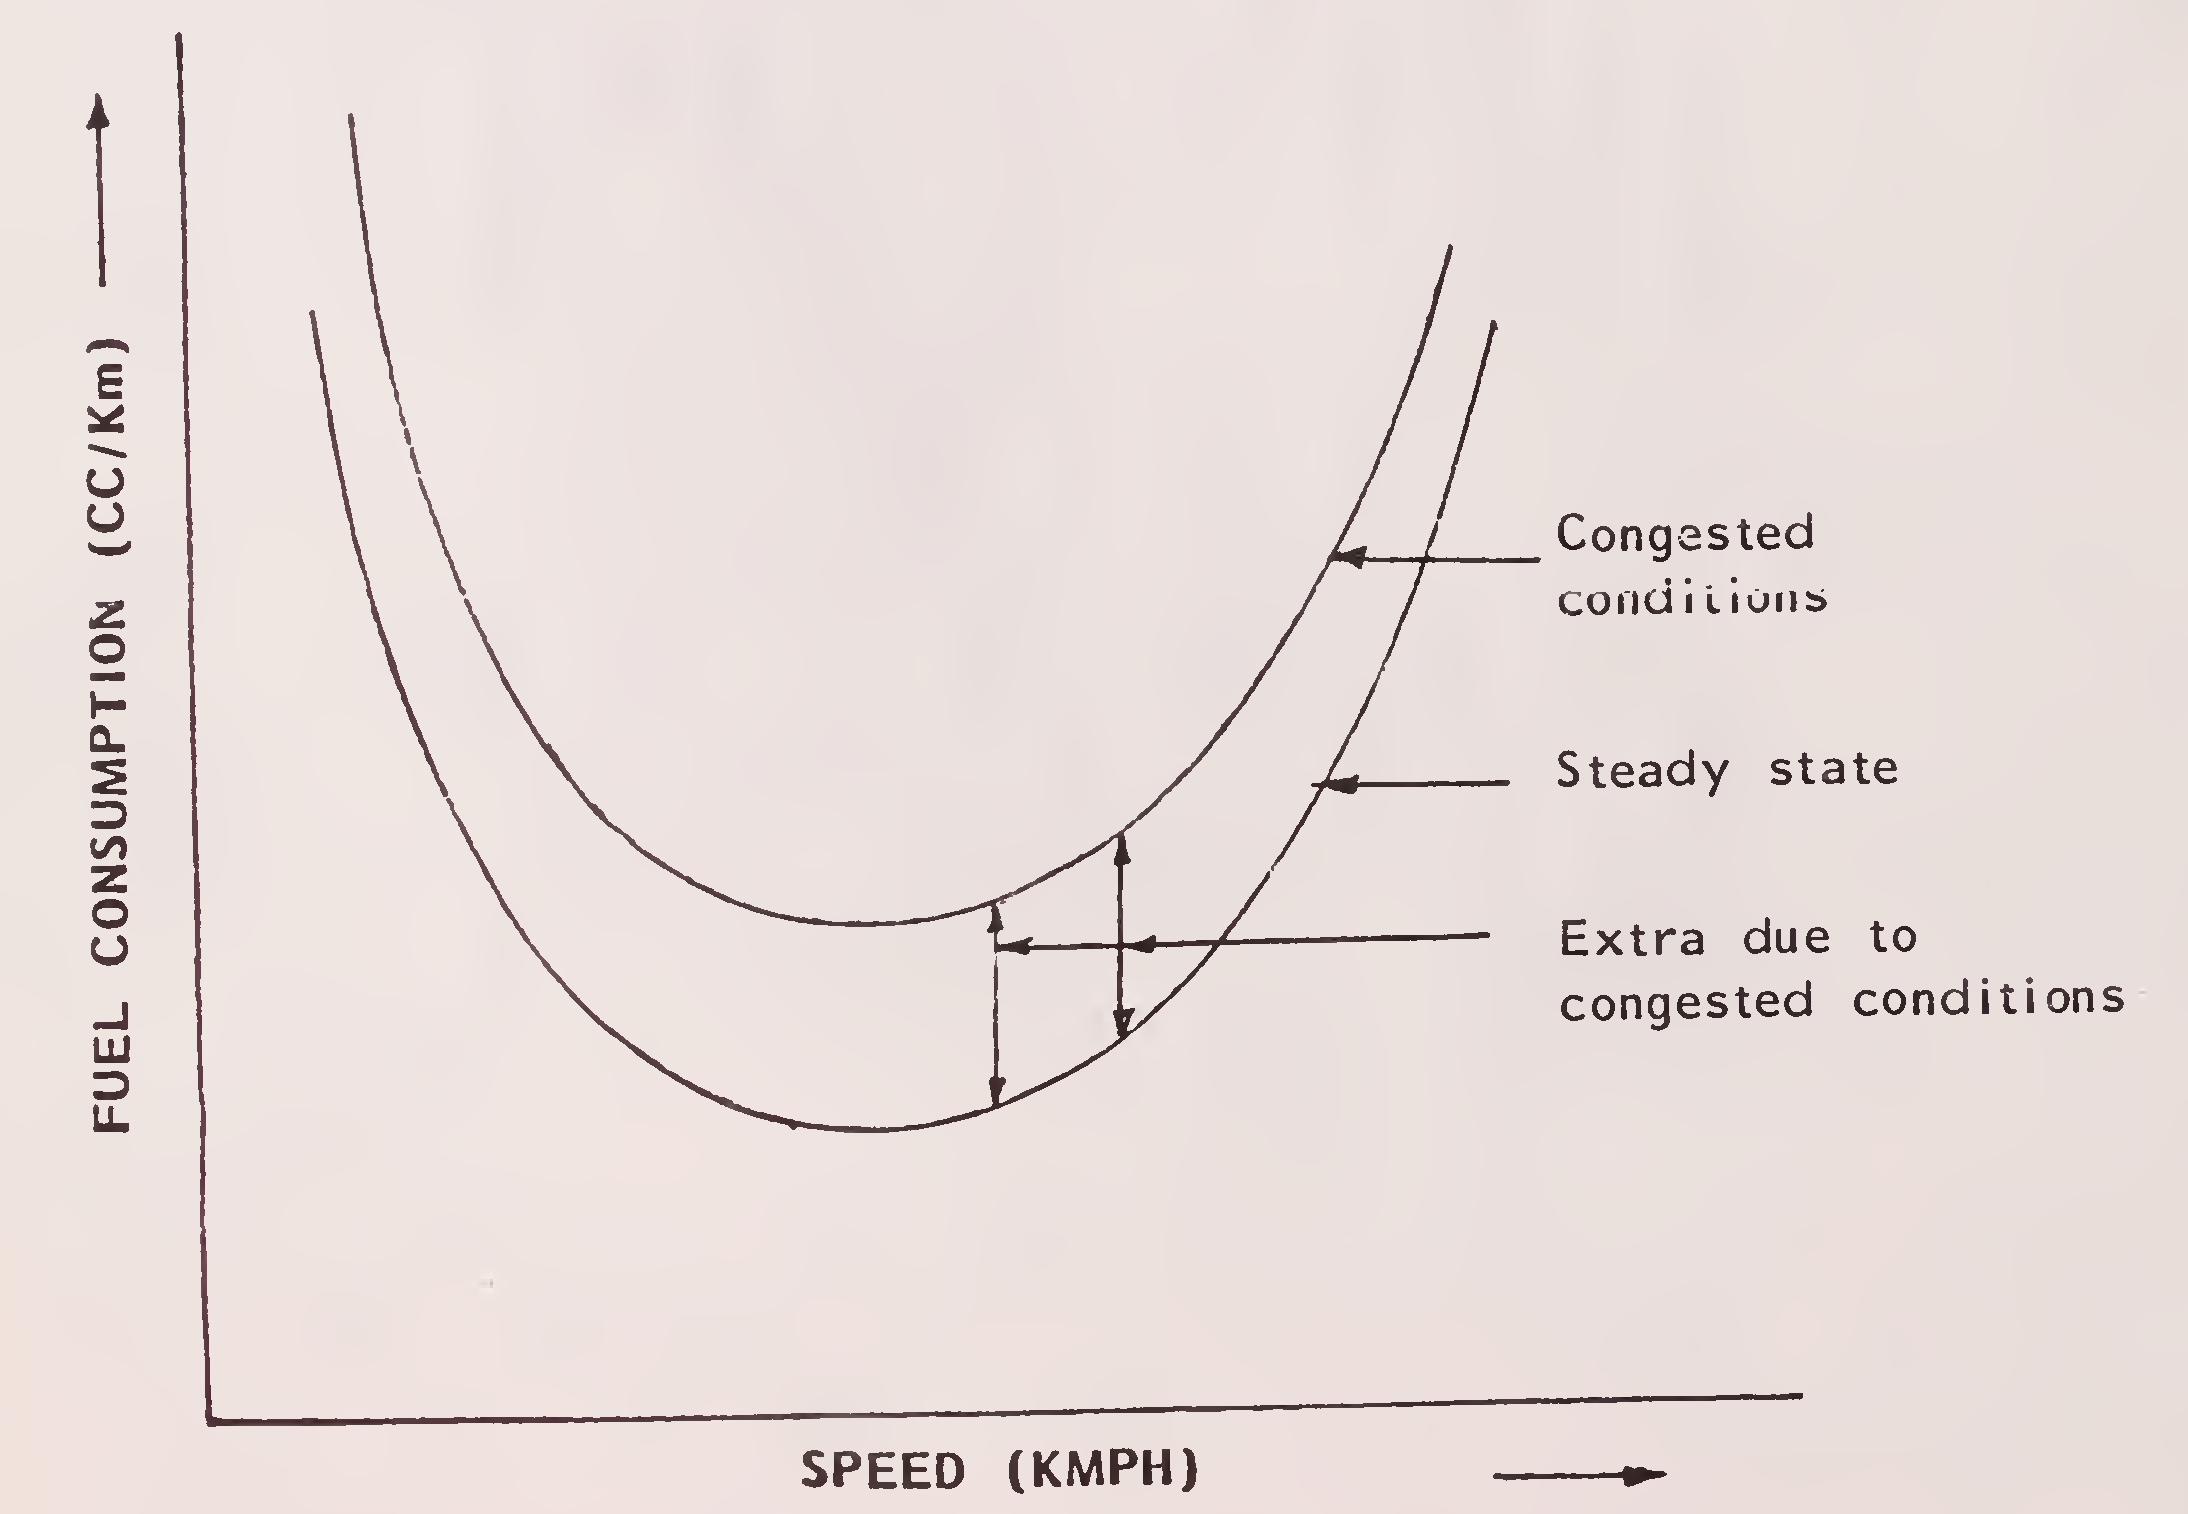
Fig. 28. Fuel consumption under steady state and congested conditions38
research carried out in India have quantified the excess fuel consumed under congested conditions. The excess is in the range of 40-70 per cent. This is a serious loss and can be prevented by timely augmentation of road capacity.
Lately the cost comparisons of flexible and concrete roads are being done in terms of whole-life-cycle cost where both initial construction cost is clubbed with maintenance cost to get a realistic comparison. The studies have proved that generally concrete roads are cheaper. A study in USA has shown that there can be fuel saving to the extent of 20 per cent in the case of heavy vehicles using properly designed cement concrete roads. The reason attributed to this saving is that the heavy trucks cause relatively more deflection on flexible pavements than on rigid pavements and part of the energy is expended in deflecting the pavement which otherwise would be available for propelling the vehicle and partly more energy would be lost in surmounting constantly the ridges of deflection basin by the moving wheel. However, their claim of 20 per cent saving in fuel is applicable only to heavy vehicles plying in the USA and the type of rigid pavement constructed there.
A study done on a 1.6 km cement concrete pavement in North India has shown that about 5 per cent - 9 per cent fuel saving is possible in the case of heavy vehicles if flexible pavements are replaced with concrete pavements. Fig. 29 depicts is a typical curve showing the relation between Fuel Consumption (cc/km) vs speed (km/hr) for a truck with a pay load of 15 tonnes. The percentage of National Highway in the country is in the order of a mere 2 per cent of the total road network and if they are converted to cement concrete roads, the saving is of the order of Rs 560 crores of fuel per year. There are also savings in other vehicles operating costs that can be brought about (tyre wear, maintenance and repair cost, depreciation, etc.). All these savings amount to nearly Rs 13,000 crores over a period of 12 years.
The technology of vehicle fleet in India is a little outmoded. A lot of changes have taken place in the countries abroad, resulting in fuel savings. This is brought about by better engine design, use of aerodynamic shape of bodies, use of light weight materials like plastics, fibre-reinforced-plastics and ceramics, thinner sections and smaller size of vehicles. A typical example39
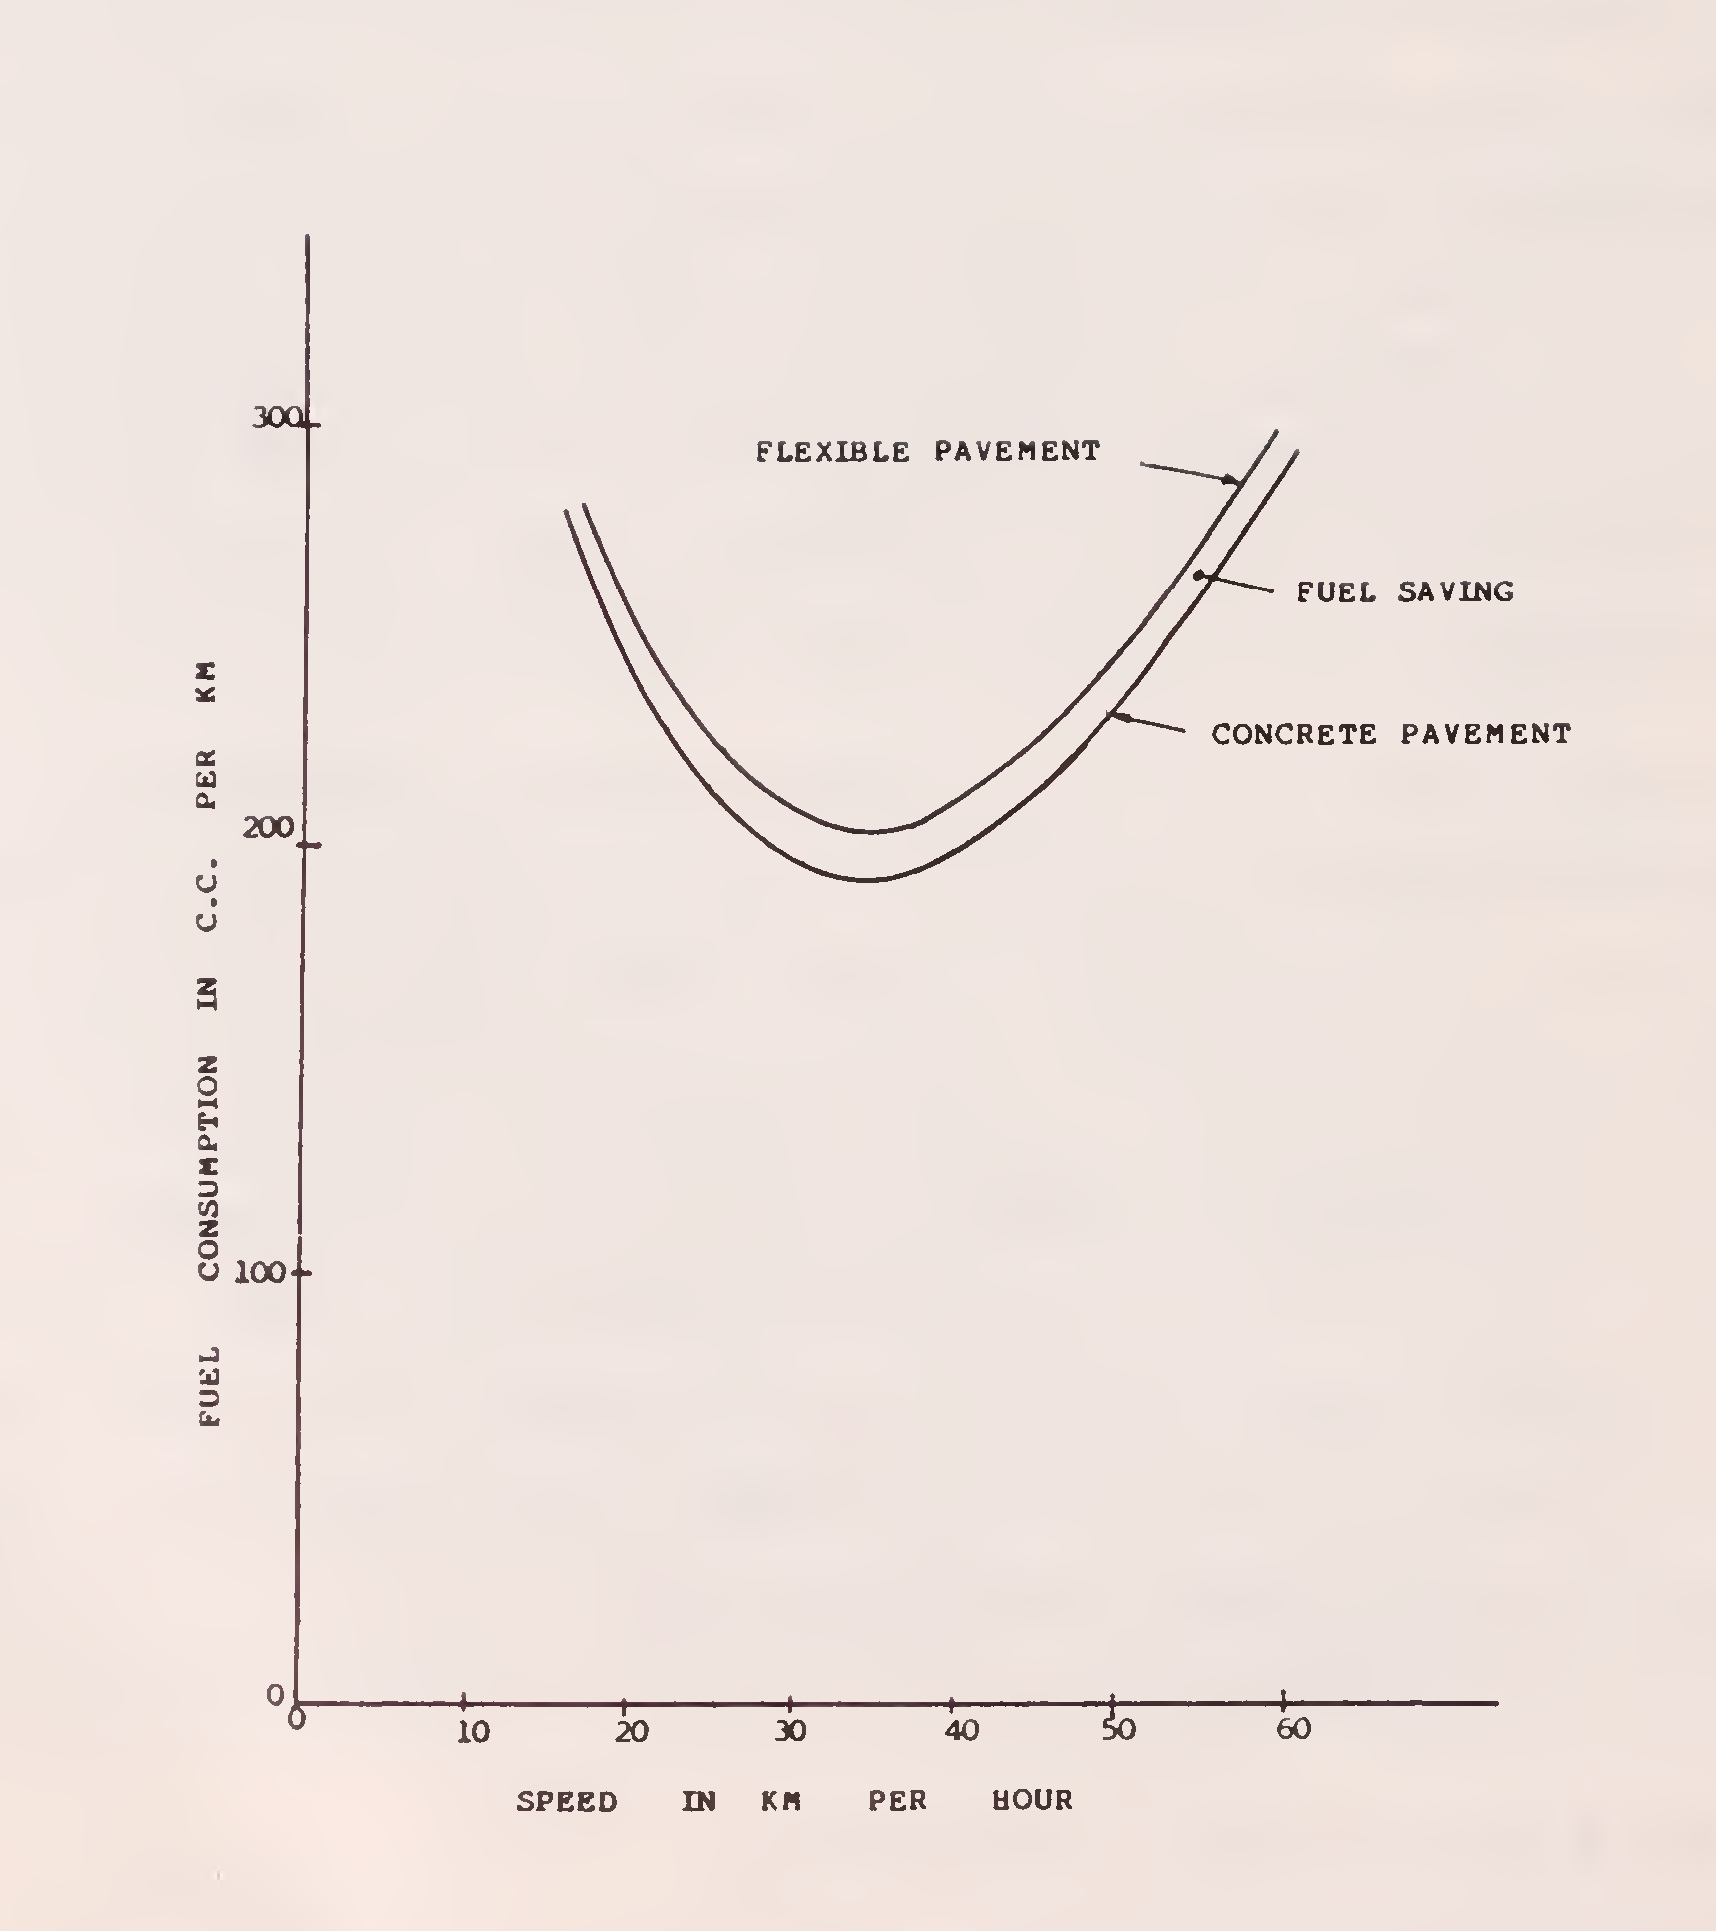
Fig. 29. Fuel consumption of truck with 15-T pay load40
is the Maruti Car. This is shown in Fig. 30. At optimum speeds, the fuel consumption of an Ambassador Car is nearly 70 per cent higher than of a Maruti Car.
Trucks can be made lighter by replacing wooden bodies by steel or aluminium. Buses can be made lighter by having aluminium bodies instead of steel.
There being a limitation in the identification and production of more
energy sources, the energy policy of the Government needs to be given more attention to demand management in the form of more scrutiny and emphasis on its efficient use. In this direction even energy audits and standardisation of various equipments and machineries being used should be taken up in energy conservation programmes.
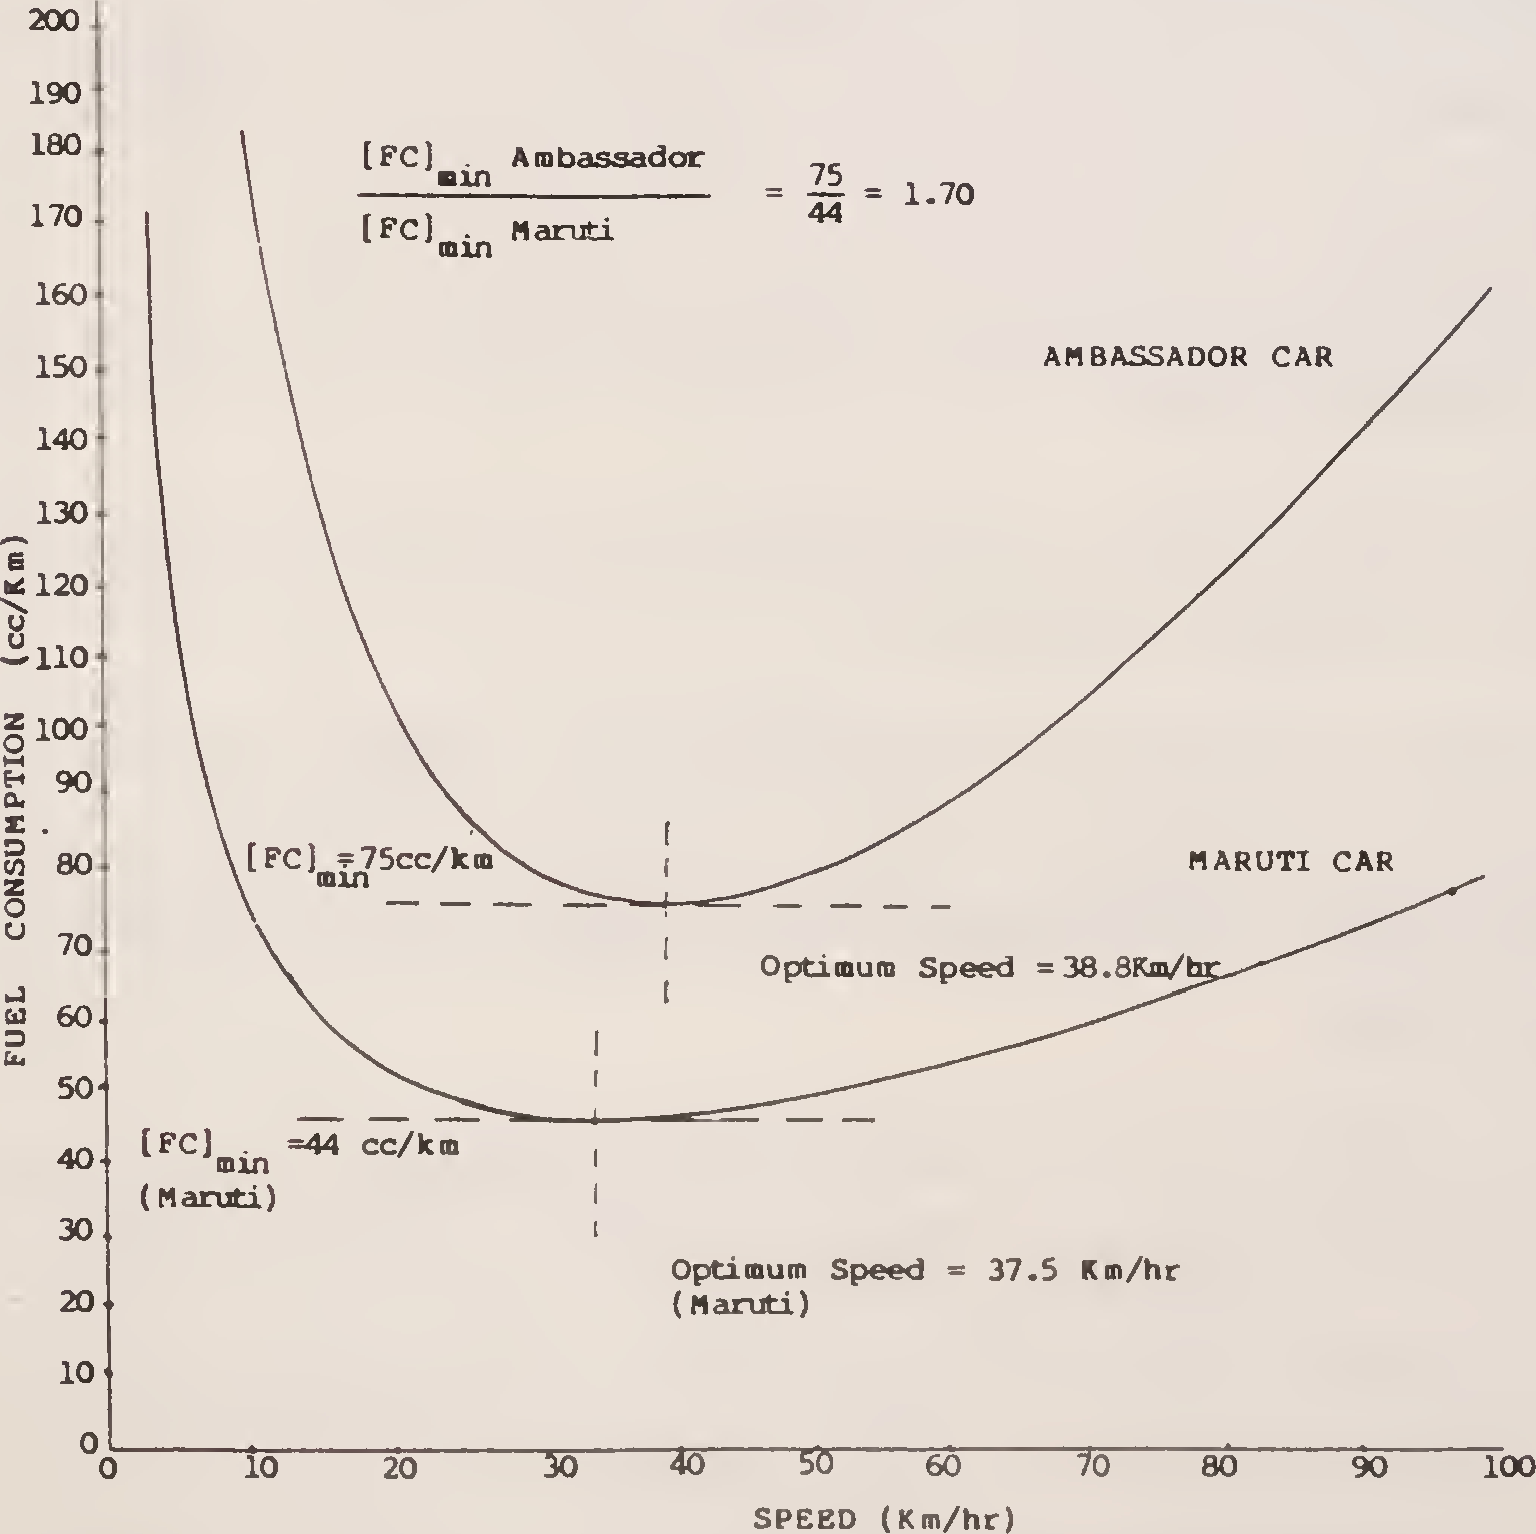
Fig. 30. Consumption - speed plots for Ambassador and Maruti cars41
There are many energy saving measures in the road sector which can be adopted to save substantial amount of fuel. This calls for a great deal of management and planning skill to harness benefits by planners, builders and users of the road. The important measures recommended for adoption under various heads are :
| A. | Improvement of Road Infrastructure |
| 1. | Widening of roads to avoid congestion of roads. |
| 2. | All earthen roads should be paved with WBM and then bituminous surfacing and all WBM roads should be provided with thin bituminous surfacing. |
| 3. | Four laning of all segments of arterial routes viz. National Highways, carrying heavy traffic volumes. |
| 4. | Construction of Expressways along selected routes. |
| 5. | Construction of by passes, and ring roads around towns. |
| 6. | Synchronised signalling of adjoining intersections should be adopted in cities to achieve optimal use of road network to quickly dispose off the traffic. |
| 7. | Road encroachers and hawkers should be cleared so as to remove side friction to traffic flow. |
| 8. | Removal of irritants like octroi posts and rail road crossings where fuel is wasted by waiting vehicles. |
| 9. | Concrete roads are now proved to be fuel efficient with 5 per cent -9 per cent saving in the case of heavy vehicles. Heavily trafficked roads should be slowly converted to concrete roads which are almost maintenance free. |
| 10. | Recycling of old bituminous mixes from failed pavements is a practical step in conserving energy. This should be seriously taken up. |
| 11. | Mechanised production of asphalt mixes and paving results in durable and long lasting roads and hence should be adopted in a big way. At the same time emphasis should be given to produce durable asphalt mixes. Quality assurance system should be introduced in the projects.42 |
| 12. | Bituminous emulsions can be used in cold condition in road mixes thus saving energy required for heating aggregates and bitumen in Hot Mix Plants. |
| 13. | A Comprehensive Maintenance Management System should be introduced. |
| B. | Traffic Management and Regulation |
| 14. | Improving public transport by rationalisation of Bus routes and adopting Bus priority measures. |
| 15. | Control on ribbon development and removal of encroachments. |
| 16. | Improvement of intersections. |
| 17. | Segregation of slow moving traffic. |
| 18. | Improving parking facilities and preventing on street parking. |
| 19. | Synchronisation of traffic signals in urban areas. |
| 20. | Encourage and provide facilities for non-motorised modes viz., cycling and walking. |
| 21 | Improving traffic flow by techniques such as one way streets, contraflow, side street closure, turning and entry restrictions. |
| 22. | Optional use of traffic control devices to guide and streamline traffic flow. |
| 23. | Road pricing in congested areas. |
| C. | Modernisation of Vehicle Fleet |
| 24. | New technology vehicles should go in for aerodynamically efficient vehicle body. |
| 25. | Designing of efficient engines. |
| 26. | Improving suspension and braking system. |
| 27. | Increasing Power to weight ratio. |
| 28. | Development and use of battery operated vehicles. |
| 29. | Emphasis on use of multi-axle vehicles43 |
| 30. | Use of radial tyres can save 3 to 5 per cent diesel. |
| 31. | Traffic education - on driving methods, better maintenance methods of vehicles etc. to drivers. |
| 32. | Opening up of automobile clinics. |
| 33. | Stricter penalty on vehicle owners using vehicles emitting harmful gases in excess of safe limits. |
| D. | Other Planning Measures |
| 34. | Land use transport planning to minimise transport demand. |
| 35. | Encouraging use of high occupancy vehicles. |
| 36. | Development of high capacity of mass rapid transport system (MRTS) in Metropolitan cities. |
| 37. | Development of pedestrians Malls on shopping streets. |
| 38. | Educating drivers on importance of consumption of fossil fuel and means of its conservation, through mass media viz., News, TV, Radios etc. |